We’re two weeks into the ACC season, so I thought that I would take a look and see how the conference is shaping up since entering league play. But before we get to that, I’m going to make a valiant effort to explain what is going on with the “numbers†used in these updates and what they mean.
RPI PRIMER
Many people’s eyes roll back in their head whenever someone mentions RPI. But I’m going to mostly skip the math and give a 50,000 ft explanation for what is going on and why it matters.
The RPI formula is just a compilation of winning percentages:
(Factor A) x your winning percentage +
(Factor B) x opponents’ winning percentage +
(Factor C) x opponents’ opponents’ winning percentage
= RPI
Note that the team’s winning percentage is adjusted for home and away games, but this is not really that important for our purposes here. So just looking at that simple formula, we see that:
When you win, your RPI goes up.
When you play winning teams, your RPI goes up.
Pretty simple, yes?
Now one of the parts that confuses people is that the number you actually see published and discussed is the RANKING of this RPI for all 300+ basketball teams in Division I. So how a given game affects your RANKING will depend on WHO you played, WHETHER you won or lost, and HOW everyone around you in the rankings did as well.
So my advice is not to get wrapped up in discussions of how much a win (or loss) affected your ranking and why that was different than what happened the week before. RPI calculations haven’t changed the obvious truth that winning is good and losing is bad. RPI is simply a way to quantify how good or how bad.
SO WHY DOES THE RPI MATTER?
In my opinion (humble, but accurate), the confusion among fans starts with clueless talking heads in the main-stream media ranting about things that they won’t bother to study. The NCAA Selection Committee developed (and have modified) the RPI formula to HELP them pick the at-large bids and to seed the teams in the NCAAT formula. The RPI is not analogous to the BCS calculations in that the RPI ranking is not blindly followed. It is simply a tool to aid in the selection process.
We have been studying the selection process over the last five years here and worked on developing some quick and easy-to-follow guidelines for evaluating the ACC with respect to probability of being selected in the NCAAT. For these in-season updates, I use the following guidelines based on our previous work:
Top 40 RPI and min of 0.500 ACC Record = IN
RPI Ranking >75 = OUT
Everything Else = BUBBLE
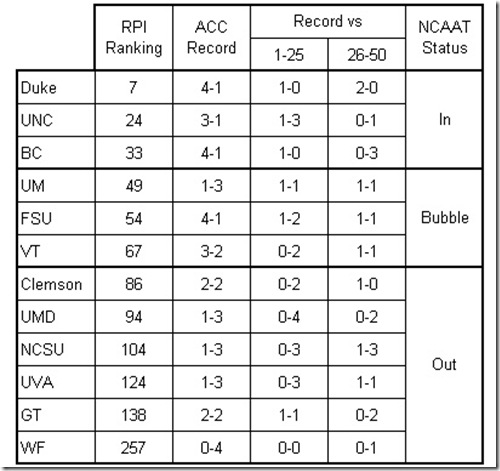
In the last update just before the ACCT, we will scrutinize the teams more closely than is warranted for these quick updates. So here’s where the ACC teams currently stand:
Rankings from CBS Sports
OBSERVATIONS
– When comparing to our first look this year, Miami is this week’s big loser. As they continue to lose conference games, their RPI has dropped them onto the bubble.
– Over the last two weeks, VT and FSU have managed to climb up on the Bubble.
– All six teams IN or on the Bubble have at least one Top-50 win (which is good). Five of the six teams have a Top-25 win (which is really good).
-As teams move up and down in the RPI rankings, the opponents ranking columns will obviously change, sometimes dramatically. Two weeks ago, Duke had six top-50 wins. Now they only have three.
– For some time, George Mason has been State’s best win. Over the last couple of weeks, they’ve been moving back and forth across that Top 50 line. As of this morning, they were ranked 40th.
– If anyone is interested in what it would take to move from our OUT category and earn a spot in the NCCAT, we have previously looked at what it takes to dig out of a hole with two examples of ACC teams that managed to turn their seasons around and make the NCAAT.
THE EFFECT OF AN ACC SCHEDULE ON A TEAM’S SOS
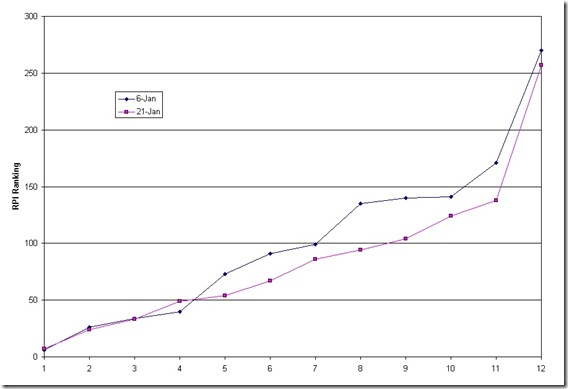
At the last update, there were a number of comments speculating on the effect that an obviously down ACC would have on the team’s strength of schedule (which is calculated using the last two lines of the RPI formula discussed above). So I thought that I would do something new and graph the ACC’s RPI ranking from 1-12 and then compare with the update from two weeks ago.
Here’s my interpretation of this graph.
– Even though the ACC is down, most of the 31 conferences are still weaker than the ACC. Thus just playing an ACC schedule improves a team’s SOS and we see an RPI increase on every team from 5th place through 12th.
– For every team that moves up in a ranking, at least one team must move down. So the mid and low majors must be mostly moving down from their SOS declining as the ACC (and other top basketball conferences) are moving up.
– There is no need to really beat this issue to death. I just thought that it was interesting to see how much two weeks of league play affected the RPI rankings.
CONCLUSIONS
I don’t’ follow the brackets that various people have been putting up since last April. If you follow these brackets, then share that info with the rest of us in the comments.
My guess is that a best-case scenario for the rest of the season would put 5 ACC teams into the NCAAT.


