First, something for the liberal-arts lovers:
“All our knowledge has its roots in our perception.” Â -Leonardo da Vinci.
I wonder if da Vinci ever tried quantifying perception?  Every college program has coaching dynasties that we view, or perceive, as “good programs”.  To back this up, we have all of the records, stats, and bowl trophies to prove who was and wasn’t a great asset to our athletic programs.  That’s all well and good for sitting around remembering “the good ole days” or how “ole Lou could really coach”, but what I want to know is if there is some way to look at the results of our past coaches, apply a little common sense, and derive from coaches that we “know” were great coaches what it will take for Tom O’Brien (or any current coach) to be considered successful.  To do this, I had to look at NC State’s past coaches, eliminate those that were either failures or were only at NC State for “fill in” duty (like Al Michaels after Earle Edwards in the early 1970’s), and create a “composite score” for each coach that allows for a common basis for comparison.
LOGIC. First I had to determine what NC State fans really care about. Â After a lot of soul searching, and after requesting spiritual assistance from the wolves in-front of the Murphy Center via burnt ram offering, I determined that three things significantly factor into our perception of a season’s success: overall record, ACC record, and likelihood of a bowl bid. Â The only potentially controversial assumption made here is that we can ignore the effects of bowl expansion. Â My only basis for this is because not making any bowl, generally speaking, seems to be taken significantly worse amongst the NC State faithful than making a “lesser” bowl. Â Regardless, I think the outcomes of this analysis are pretty accurate.
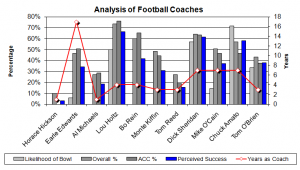
Figure 1 shows the comparison of NC State’s coaches across the board. Â The overall and ACC winning percentages are self-explanatory. Â The “Likelihood of Bowl” basically determines how often a coach made a bowl game given the length of his tenure (in years) at NC State. Â The perceived success is simply an average of all three of these percentages.
The assumption is that all three of these factors weigh on a fan’s perceived success equally. Â For example, if a coach does poorly amongst out of conference (OOC) opponents, but seems to compete extremely well with ACC opponents, NC State fans are likely to be similarly as pleased, in general, as if a coach had a “decent” overall record, consistently beat OOC teams (including BCS teams) but lost a couple ACC games. Â A coach is likely to also get a slide on his overall record if he makes a bowl almost every year. Â There are always exceptions to this rule (i.e., bowl expansion being the biggest one), but IMO, this trend seems to hold true.
Looking at Figure 1, we can pull out who would be viewed as probably the most successful coaches. Â Again, this is just a general broad-brush of each coach’s careers, not an analysis of why each coach did well. Â Just to be fair, I ran the spreadsheet eliminating the “fru-fru bowls” (Meineke Bowl and MicronPC Bowl) and adding 1 “bowl bid” for seasons where NC State finished atop the ACC. According to this analysis, NC State’s most beloved coaches,and composite scores, would be the following:
- Lou Holtz – 0.748*
- Dick Sheridan – 0.615
- Bo Rein – 0.501*
- Chuck Amato – 0.488*
- Mike O’Cain** – 0.323*
*Composite scores are different from those in Figure 1 (Perceived Success) due to the subtraction of ‘lesser bowls’ and addition of ACC champion status.
**It’s worth mentioning Early Edwards would have a composite score of 0.442 giving the addition of ACC “championship seasons” to the bowl count.
This is all well and good, but what good does it do us to mathematically compare coaches without coming up with some useful model to project with? Â Well, I’m glad you asked.
Tom O’Brien, after his third season, was 0.432 overall and 0.375 in ACC play. Â Not too hot. Â The only permanent coach worse than that was Tom Reed (0.273/0.190 ACC) who also came into NC State as a “successful” coach at his former post (32-19-2 at Miami-Ohio). Â Not a fair comparison of TOB to Reed, but the numbers ‘are what they are’.
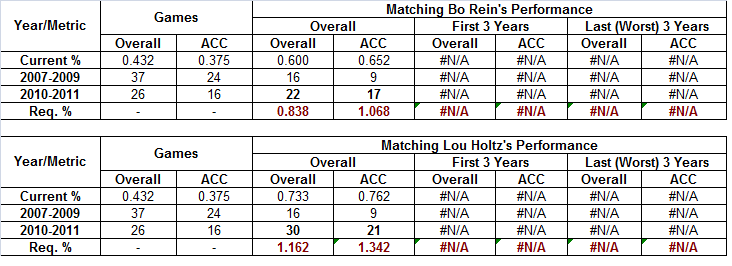
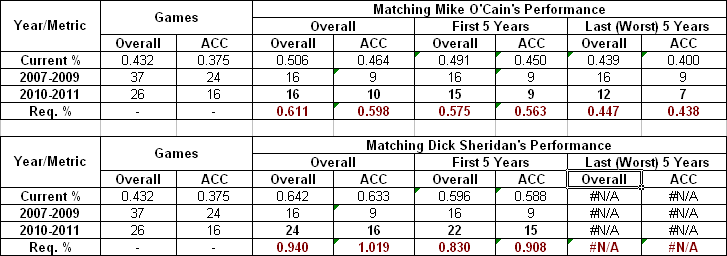
So what does Tom O’Brien have to do to achieve the winning percentages of his predecessors?  First an assumption: I assume Tom O’Brien will be allowed to coach for 5 years.  I looked at what other coaches’ overall results, first 5 years, and “worst” 5 years looked like and compared them to what Tom’s current record is now as well as what his record will need to be in the next two years to achieve any sort of comparable success to past coaches.  Possible game totals assume a bowl will be attended, giving O’Brien the chance for another win each season.
(The “Games” column(s) represents the total number of games played overall and in the ACC for the corresponding row’s time period. Â The ‘Coach %’ in this column refers to O’Brien’s winning percentages. Â The remaining data corresponds to the number of wins O’Brien did or will need to achieve to attain the winning percentages in the top row. Â The winning percentage in red is the win percentage O’Brien will need to achieve to match the record of each table’s coach in each columns’ time period.)

This analysis takes the burden of making “fru-fru bowls” off of O’Brien to compete with Amato.  In order to accurately compete with Amato’s overall record, he would have to have win three quarters of his overall schedule, but only a little over half of his ACC games.  This required winning percentage for O’Brien pin-points one of the biggest issues with Amato: O’Brien’s predecessor had a problem competing in the ACC. The easy solution for O’Brien is to beat his ACC opponents and this already begins to set himself above his immediate predecessor.
Sheridan is lacking an analysis for the worst 5 years since his first 5 years were his worst. Â Imagine that; a coach who actually doesn’t suffer performance as he becomes more experienced in the Wolfpack head coaching role. Â It’s been a while since we’ve seen that.
Note that below, both Bo Rein and Lou Holtz failed to serve more than 3 seasons. Â This means that all we can compare O’Brien against are their career results at NC State for Overall and ACC winning percentages.

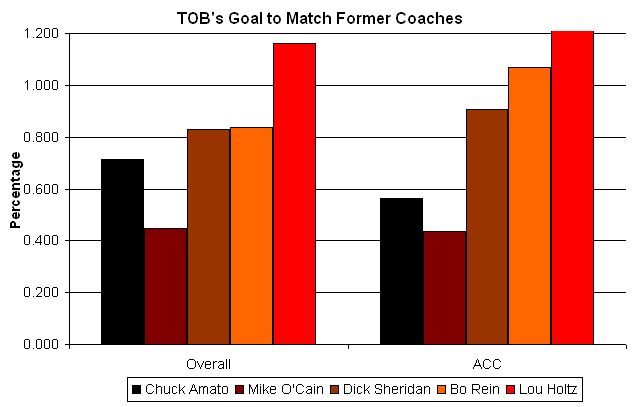
Comparing Tom O’Brien’s required performance to the worst 5-year period under any give coach produces Figure 2.
In the words of Tom O’Brien’s big buddy, Mike Archer, “It is what it is.” Â Tom basically can either fall in the category of the Amato’s and O’Cain’s or he can strive to sit with the Sheridan’s, Rein’s, and Holtz’s… well, sort of. Â Some of these levels of achievement O’Brien simply can’t achieve in this first 5 years, despite the fact that only the worst 5 years from each of these coaches was considered.
O’Brien is looking at moving from a sub-50% team overall and in the ACC and transforming it to an over 80% team in order to be considered one of our “good” coaches.  I’m willing to give any man worth his salt the benefit of the doubt, and we would be remiss to say Tom O’Brien isn’t a good man with a good career and a solid head on his shoulders.  Hell, those are a few of the reasons why I liked O’Brien so much when he came to State in the first place!  Unfortunately, when you are playing the game of football, fans don’t care nearly as much about how honorable you are compared to how much you win.  Well… unless you are so dishonorable that you allow your players to receive completed homework from former nanny’s and associate with NFL agents in violation of NCAA regulations…
…but that’s another story.
Tom, it’s very simple: start winning. You are behind in the polls and you are looking at a hard climb ahead of you. Â At this point you can either (a) admit that the expectations are simply to hard to meet or (b) make some hard decisions, get this train back on track, and start putting up some points, or as our particular problem would be, prevent the other team from posting a score. Â Going into this pre-season, I have run the gambit of dejected to curious to excited and back to dejected. Â I don’t know what to expect out of O’Brien this season, but I am sure am rooting for him to be closer to that 80% success mark than the 40-45% mark we have been seeing.
[UPDATE: For a short period, there was some errant data concerning TOB’s required achievement to match O’Cain and Amato’s ACC records. This has been corrected.]


You must be logged in to post a comment.