There has been a lot of discussion (going back to last April) about how the ACC would be “down†this year. I even saw one comment this season proclaiming that this year was the weakest ACC in memory. So I thought it would be worth the time to put a little perspective on conference rankings and to document exactly how much the ACC is down this year. (Side note…for those that don’t like discussing RPI, this is the point where you need to move onto your next internet surfing location.)
Before I get to historical rankings, I want to point out that in a mathematically-based conference ranking, the bottom of the conference is going to matter just as much as the top. So a mathematical ranking can produce a different ranking than what a lot of people build in their mind when all they see is that Conference X has 5 teams ranked in the Top-25 and Conference Y only has 3. This difference is not any big deal as far as this entry goes, but it is something to keep in mind as this type of discussion frequently comes up in both football and basketball.
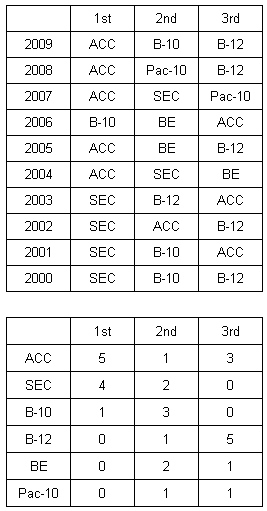
In 2010, ACC basketball is currently ranked third. I don’t think that this ranking will change now that everyone is playing their conference schedules, but I’m not totally sure. So we’ll only look at end-of-season rankings for the last 10 years (2000-2009), from the RPI calculations:

The main reason that I went back to 2000 was that I knew from previous research where the “body was buriedâ€. In 2000, the ACC was the 7th ranked basketball conference, behind the other five BCS conferences and C-USA. So unless we have posters here that are still in elementary school, this year is not the weakest ACC you have ever seen.
For those of you that enjoy trending like I do, I have prepared some graphs to answer two different questions:
– How much difference is there between a #1 and #3 conference?
– How much difference is there between a #1 conference in different years?
To illustrate the difference between a #1 and #3 conference, here is a graph that summarizes the RPI rankings (thru games played on 1/18) of this year’s Big East teams (ranked #1) and the ACC (#3):
(Right click and open in new window/tab)
It seems like this graph should be self-explanatory.
Now let’s look at how much difference there is in a #1 ranking from year to year. From the first table listed above, the ACC was the #1 ranked conference from 2007-2009, so let’s look at those three years:
(Right click and open in new window/tab)
This graph gives us a rough idea of how much variation can occur from one year to the next. From looking at this graph, it should also help explain why the #1 ranked conference sent seven teams to the NCAAT in 2007 and 2009, but only four teams in 2008.
So after all of this, how important is conference ranking?
First of all, I didn’t do this entry because conference ranking has some huge, little discussed significance. I did the research to provide a little perspective on this season as well as future/past seasons.
If you are one of the top teams in the country, then conference ranking probably doesn’t have much significance. Memphis (with Calipari) and Gonzaga are two recent examples of programs that have risen to national prominence/recognition even though they play in weak conferences. On the other end of the spectrum, there is no solace in being one of the bottom teams in a strong conference. But in the middle of those two extremes, conference strength can play a role for a bubble team.
We’ve discussed The Dance Card here a number of times over the last several years. Briefly, two college professors have studied the Selection Committee’s decisions and derived a formula to predict which teams will “clear the bubbleâ€. Surprisingly enough to me, they only needed six factors to develop a formula that shows a strong correlation with the Selection Committee’s decisions:
– RPI (Ratings Percentage Index) Rank
– Conference RPI Rank
– Number of wins against teams ranked from 1-25 in RPI
– Difference in number of wins and losses in the conference
– Difference in number of wins and losses against teams ranked 26-50 in RPI
– Difference in number of wins and losses against teams ranked 51-100 in RPI
The bottom line is that State fans probably won’t care very much about conference ranking this year…but hopefully we will in the near future.
OOC Strength of Schedule
I have not delved into the inner-most calculations behind conference ranking. However, a key aspect of this ranking is the overall OOC schedule played by the ACC schools and its performance against those teams. As I was going through the SFN archives, it occurred to me that I have missed several “annual†updates on the OOC SOS. So this looks like a good place to catch-up on the OOC SOS through last year. Sometime after this season ends, I hope to put up a short entry to get us completely up to date.
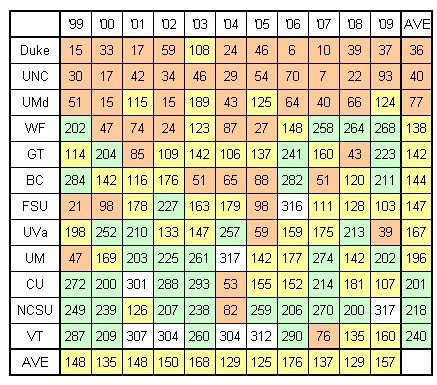
Here are the OOC SOS rankings for the current ACC teams since 1999.
Beyond providing a way to detect trends, this table completely destroys the myth that OOC schedule strength is a matter of luck. Strength of schedule is a choice….some teams/coaches choose to have a strong schedule and others consistently run from them.
The comment that I made earlier about conference rankings also applies to SOS rankings….the bottom 4 or 5 teams in your schedule are just as important as the top 4 or 5. Scheduling a few “name†teams is not all that is required to produce a reasonable OOC schedule. Some teams/coaches obviously understand this and others either don’t understand or choose to ignore the implications of a weak OOC schedule.
Trends of interest
– I can remember making fun of Clemson’s OOC schedule in high school over 30 years ago. It’s very clear that Oliver Purnell has changed things there. In fact, Clemson has moved past State in average OOC SOS since my last update.
– It appears that Skip Prosser made a drastic change for the worse in WF’s scheduling practices over his last several seasons there….one that Dino followed his first several years. WF’s OOC SOS is currently ranked 119, which may signal a change for Dino.
– Seth Greenburg also made a drastic change at VT…or he had until this year (more on VT below).
– Leonard Hamilton and FSU may have learned a valuable lesson in 2006. The 2006 FSU team is one of the examples that I use to justify my formula for how to fall into the NIT (which is one of the reasons that we have tracked OOC SOS):
Weak OOC Schedule +
Marginal Conference Performance +
Poor Conference Tournament Performance=
NIT
Along with FSU (2006), you can add UVA (2000) and VT (2005) as ACC teams used to justify my conclusion. Outside of the ACC, ASU (2008) and Penn State (2009) also support this conclusion.
ALL CUPCAKES ARE NOT CREATED EQUAL
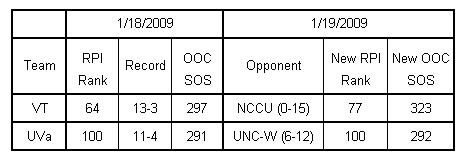
Monday night’s schedule provided an opportunity to illustrate just how cupcakes affect a team’s RPI ranking. Both UVA and VT beat an OOC cupcake on Monday night, so let’s take a closer look at what effect the cupcake victory had on these two teams:
I get several things from this table:
– Beating a bad team doesn’t always help your RPI ranking, but beating a truly miserable team can really hurt.
– Last night provides a preview of what will happen to State when it plays NCCU on Jan 30.
CLOSING THOUGHTS
Unfortunately, none of the issues raised in this entry are likely to affect State this season. However, there is always value in providing a historical perspective of exactly where the ACC sits in a given season and how the overall conference strength varies from one season to the next. Likewise, the current philosophy of scheduling a horrendous OOC schedule is not likely to have impact on State fans this season, but could in the future.


You must be logged in to post a comment.