I always enjoy looking at the ACC just before the ACCT starts and discuss who needs to do what to get an at-large bid to the NCAAT. As a precursor to that discussion, this looks like a good time to summarize what we have learned over the past several years about moving off of the NCAAT bubble into either the NCAAT or the NIT.
Much of this has been discussed before, but many of the tables in older entries have not fared well through several server transitions and are either gone or only marginally readable. So let’s put all that we’ve learned in one place and hope that Alpha doesn’t screw it up during the next computer/software upgrade. 😉
Bubble Definition for Dummies
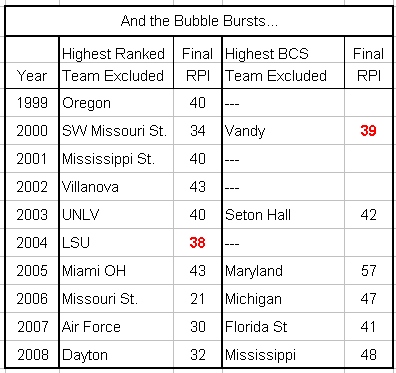
An uber-simple definition of the NCAAT bubble can be created by looking at the RPI ranking of teams from past years that have received at-large bids to the NCAAT. So here are the highest ranked teams excluded from the NCAAT over the last ten years.
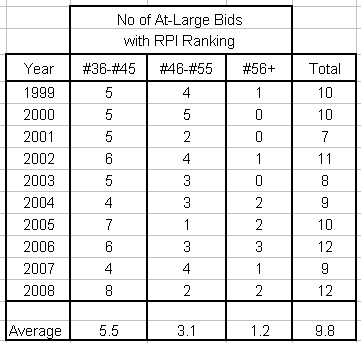
Now let’s look at the back end of the Bubble to see what was the lowest ranked team to get an at-large bid?
So if we eliminate the Mid-Majors from consideration, we get a simple NCAAT bubble definition based on RPI rank ranging from 38-65. If you’re better than that, move to NCAAT seeding discussions. If you’re worse than that…start lobbying for an NIT slot.
Now let’s look at one last table to refine the topography within our bubble range of 36-75:
None of this means that an NCAAT Selection Committee member will ever say that a team’s RPI ranking just wasn’t good enough. What it means is that by the time a team has lost enough games to have a bad ranking, then there are simply a lot of better teams to pick from.
Simple Formula for the NIT
As strange as it may sound, I’ve developed a simple formula to calculate when a bubble team is headed to the NIT:
Weak OOC Schedule +
Marginal Conference Performance +
Poor Conference Tournament Performance =
NIT
We’ve documented the accuracy of my NIT formula with examples from UVA (2000), VT (2005), and FSU (2006). Last year, we even saw that this formula can be applied in the Pac-10. 😉
The last time that I checked, none of the bubble teams in the ACC have an embarrassingly easy OOC schedule this year. So we may not get any data this year to further refine this formula this year. In particular, I’m wondering what constitutes poor performance in the ACCT now that eight teams play on Thursday. My guess is that poor performance will probably extend to a loss on Friday for teams on the back-side of the bubble.
Bubble Definition for Stat Majors
I’ve mentioned the Dance Card several times before, but wanted to remind everyone again of their work. Basically, two college professors analyzed the Selection Committee choices and tried to identify correlations between the selections and various pieces of numerical data. They have identified six key criteria that can be used to mathematically define NCAAT Selection Process with pretty good accuracy:
– RPI (Ratings Percentage Index) Rank
– Conference RPI Rank
– Number of wins against teams ranked from 1-25 in RPI
– Difference in number of wins and losses in the conference
– Difference in number of wins and losses against teams ranked 26-50 in RPI
– Difference in number of wins and losses against teams ranked 51-100 in RPI
By adding weighting factors to these criteria, the professors can examine each team and then rank their chances at making the NCAAT. While the professors draw a line in the sand on their website, don’t forget the teams near that line can be affected by upsets in smaller conference tournaments.
What I find especially amusing is that each year the Selection Committee tries to distance itself from the RPI and comparisons to the BCS formula. They try to emphasize that each team is evaluated on its own merits and not on a computer formula. The accuracy of the Dance Card shows that a formula could easily be put in place to provide consistency in the selection process and avoid the outcries of favoritism or outright stupidity. A pre-set formula would certainly keep the Selection Committee from repeating some horrendous mistakes that they have made in the past.
But before you jump in too hard on demanding a consistent formula, I need to point out that if the NCAA Selection Committee strictly used the Dance Card formula, then NC State would have been left out of the tournament in 2003 and 2005. As always, be careful what you wish for.
When Numbers Meet the Real World
Whenever you use a “number” that is somehow related to the won/loss record of a team, then a win in November counts the same as a win in March. However, when you go through as many bubble discussions as NC State fans have gone through this decade, then it becomes obvious that not all wins are created equal when deciding who will get an at-large bid.
I wont bore seasoned readers with the supporting examples from the past, but we’ve seen that:
– Big upsets in the conference tournament are very, very good for bubble teams.
– Big wins early in the season (especially at home) seem to be ignored or of little value.
– Losing records down the stretch are very bad. Several of the Dance Card misses (predicted in) had losing records over the last 10 games of the year.
Good Wins/ Bad Losses
We won’t belabor the good wins part too much. 20 wins mean nothing if you haven’t beaten a few good teams along the way. But if you have some other things going for you within your resume, you don’t need very many good wins. In 2002 and 2003 combined, NC State had grand total of three wins against teams that made the NCAAT; but received at-large bids both years.
I have a theory about bad losses that I haven’t developed a lot of support for…Bad losses dont negate good wins.
Look at NC State from 2003…2-8 against the RPI Top 50 with one of those wins against #1 seed WF in the ACCT. Now let’s list the bad and embarrassing losses from that year:
UMass (#209) by an embarrassing 68-56;
GT(#76) by an even more embarrassing 85-61;
and finally Temple (#88) with a mind-numbing score of 76-54.
Since State had so few good wins in 2003, you are left with the conclusion that bad losses aren’t significant or at least not always significant.
So are the discussions about bad losses a waste of time? Probably, but then a lot of internet discussions are a waste of time. 😉
Let me back up for a minute. There are two ways to get off of the bubble and into the NCAAT:
(1) Win more games than other bubble teams (especially in the conference tournament) and
(2) Lose less than the other teams on the bubble.
I suspect that bad losses come into play more in Scenario (2) where the Selection Committee is trying to figure out which of the remaining 5-10 teams under consideration will take the last 2-5 spots. When you get down to these last teams, you are really looking hard to find distinguishing features. In this scenario, it would be easy to eliminate a team from further discussions if it had substantially more bad losses than the other teams being considered.
Now don’t take my logic as gospel. It just makes sense to me and fits within the facts that I have. If you have some contrary examples, then by all means please share them. (You all are such a shy bunch, I feel like I have to encourage you to share your opinions. 😉 )
Needing ACCT Wins
It’s always easy to pick out some teams that definitely need ACCT wins to get into the NCAAT and others that are already solidly in. But where do you draw the line between “already in” and “need more work”? This issue will probably always remain vague, but here are two teams that have to be close to the minimum acceptable criteria for “Already In”:

If some defining selection has stuck with you from the past, be sure and include it in the comments. Ideally, we would build a list of teams that landed on either side of the bubble with a first-round loss and see if we can add some more definition to this issue.
The Importance of Conference Records
It’s pretty obvious that the Selection Committee doesn’t like teams with losing conference records. I’m generally OK with this decision, but it can produce some obvious snubs when you play in a really good conference.
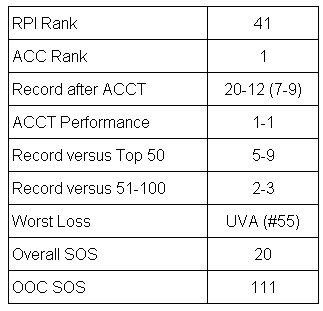
In 2007, FSU didn’t get an at-large bid with a pretty good overall resume:

FSU had two real flaws in their resume in 2007
– Losing Conference Record
– A five game losing streak in Feb gave FSU a 3-6 record through the ACCT (otherwise known as stumbling down the stretch)
State has overcome both of these issues this decade, but not both issues in the same year. It would be nice to know if one issue was more important than the other…but it is obvious that they are deadly when combined.
Common Mistakes
Within minutes of the Selection Show conclusion, talking heads and message board monkeys start in with their moaning and gnashing of teeth about the teams that were left out. However, I believe that much of the whining about the selection process can be ignored because they all make a fundamental mistake…the whiners have developed (or used) criteria that the NCAAT Selection Committee has never, ever used. Just remember that unless you are on the Selection Committee, your personal criterion is NOT being used.
Let’s look at a few of the more common “criteria” that should be ignored.
Finishing Strong Down the Stretch
– How could Team A finish the year 7-3 in a “really good” conference be left out of the NCAAT??????
Actually, the answer is…”Quite Easily”. Just because you can show that stumbling down the stretch is bad, that doesn’t mean that the converse is necessarily good. If fact, I know of no evidence that a strong finish based solely on record has ever been used. You are far better off with a 5-5 record with some good wins (see NC State in 2003) than an 8-2 record with none of those wins coming against the Top-50 teams.
Head to Head Results
Team A beat Team B twice (or 2 out of 3); but Team B went to the NCAAT and Team A went to the NIT. How is that possible???????
Easy. It’s extremely unlikely that the decision for the very last spot came down to just Team A and Team B. Thus their head-to-head records were probably not even discussed.
OOC Wins
Team A has no quality OOC wins and therefore will have a hard time getting an at-large bid. Oh really?
This one appeared last night here at SFN. My response was that the poster must have missed the Herb years at State. Today I quickly scanned 2002-2006 and here is the composite list of Top-50 OOC wins:
2004 – BYU (#31)
2005 – Louisiana Lafayette (#47)
2006 – George Washington (#37)
There are a number of conclusions that can be drawn from this list, but we are only going to talk about one. Quality OOC wins are obviously good, but are not required to make the NCAAT.
Closing Thoughts
I know that it is tempting to jump right in and start predicting who needs to do what in the ACCT. But let’s focus our comments today on what it takes in general to clear the bubble. Then at the first of next week, we will hash through the ACC teams before the ACCT starts on Thursday.
If you interested in some of our earlier entries on Clearing the Bubble, here are some that contain more details to support the conclusions that I summarized today. (Just remember what I said about missing tables or legibility issues with some of the tables.)
A Look Back at the Bubble
The Dance Card
Clearing the Bubble
Post Selection Sunday 2007 Thoughts
RPI-ology
2008 Bubble Thoughts


You must be logged in to post a comment.