Home › Forums › StateFans Basketball › NC State 2013-2014: Who were those guys? (Four Factors evaluation)
Tagged: 13-14 NC State Basketball, Mark Gottfried
- This topic has 8 replies, 3 voices, and was last updated 12 years, 3 months ago by
StateFans.
-
AuthorPosts
-
03/13/2014 at 7:55 AM #45483
MP
ParticipantI was hoping to submit a ‘fan post’ on the big board, but figured I wouldn’t have time to figure out how to do so. So I will do this here on the forums. I continue to be inspired by the data-based analysis of VaWolf82 and others and thought I would throw in a Four Factors overview – inspired by the use of Four Factors (eFG%, TO%, ORB%, and FT rate) from the guys over at Backing The Pack over the years.
Last year entering the NCAAT I kept beating the “We are better than our record indicates” drum. The reason was a crude analysis of the Four Factors (FF) over the course of NC State’s 2012-2013 season. Well, obviously that didn’t work out to well with the uninspired ’round 2′ loss in the NCAAT.
So anyway… That brings us to this season where I wondered if we are better or worse than our record indicates.
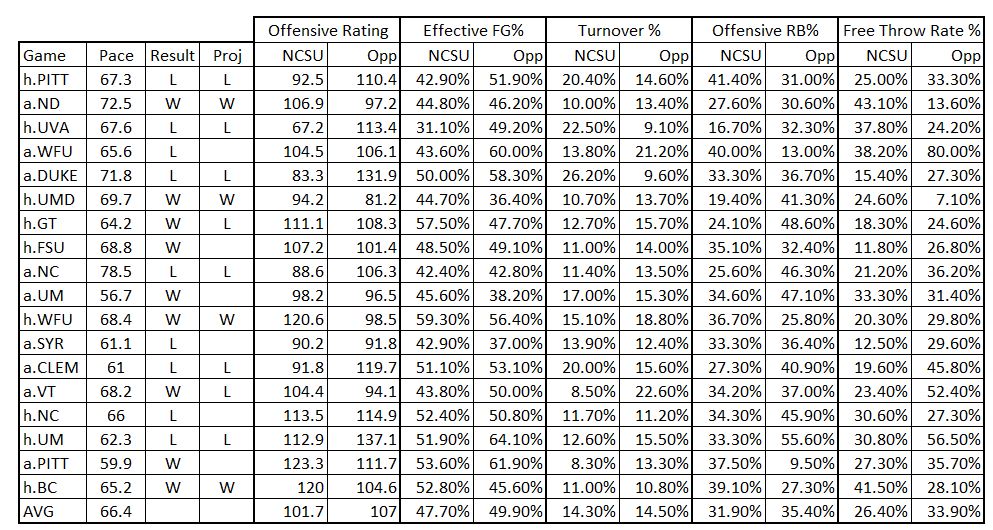
By the way, this table looks better in my spreadsheet with the use of colors to distinguish advantages or disadvantages in the various FF criteria. But here is how I (again crudely) assessed the factors:
1. If a team has an eFG% +2% better than the other, it is considered a clear advantage.
2. If a team has a TO% +3% better than the other, advantage.
3. If a team has an ORB% +4% better than the other, advantage.
4. If a team has a FTR +5% better than the other, advantage.I could describe how I not-so-arbitrarily decided on the percentages for each factor, but this is already going to be too long and it would be up for debate either way. But based on those percentages, I figure if a team held the advantage in more factors than the other team then it ‘should’ have won the game based on FF evaluation – However I chose to not give a ‘should-win’ to a team with advantage in one factor when the other 3 factors were basically a wash. What I saw in turn for this year is that NC State closed the ACC season with:
4 ‘should-wins’
8 ‘should-losses’
6 essential toss-upsThe fact is (if one is inclined toward FF being “factual”) that NC State fared very well relative to how they ‘should’ have fared this year. Splitting the toss-ups would suggest this team to have a 7-11 record. The toss-up games were even mostly on the road (4 away / 2 home), so it would not help to apply a ‘home-cooking’ factor in the toss-up games.
So as you all know, this does not really mean anything… But at least I will not walk around telling everyone that “we are better than our record says we are” this year.
03/13/2014 at 9:29 AM #45500VaWolf82
KeymasterI have to admit that I’m skeptical of this approach if it led you to reach this conclusion last year:
Last year entering the NCAAT I kept beating the “We are better than our record indicates” drum.
03/13/2014 at 1:20 PM #45526ParticipantThat looks much better… The columns across are:
Game / Pace / Result / FF Projected Result / NCSU Offensive Rating / Opponent Offensive Rating / NCSU eFG% / Opp. eFG% / NCSU Turnover % / Opp. TO% / NCSU Off. RB % / Opp. ORB % / NCSU Free Throw Rate % / Opp. FTR%
Source data comes from: http://www.sports-reference.com/cbb/schools/north-carolina-state/2014-schedule.html
Then click on the date of an individual game to see the game data.
03/13/2014 at 1:41 PM #45533ParticipantRe: Your comment about last year’s team – Basically, using the FF criteria, we lost one game that we ‘should have won’ (home against Maryland) and we had three ‘toss-up games’ – which we lost all of them. So in other words, our individual game FF numbers justified at least a 12-6 conference record; or better with any toss-up games going our way.
But trust me, I think I get your drift.
03/13/2014 at 1:51 PM #45535KeymasterUnder the “FF Projected Result”, does a blank mean “toss-up”?
03/13/2014 at 2:23 PM #45553Keymaster1. If a team has an eFG% +2% better than the other, it is considered a clear advantage.
2. If a team has a TO% +3% better than the other, advantage.
3. If a team has an ORB% +4% better than the other, advantage.
4. If a team has a FTR +5% better than the other, advantage.There are statistical packages that might be able to help correlate these factors into projected wins and losses….much like the professors behind the Dance Card analyze the NCAAT selection process. However, I have no experience with any of these packages.
The real trick would be to turn these calcs into point spreads.
03/13/2014 at 5:07 PM #45588ParticipantSorry got quite busy this afternoon. Yes! The blanks mean toss-ups just like you have it in the updated table.
And it would be very cool to know if statistics could be applied. I’m not the best for that. My margins basically came from staring at the ceiling and speculating on what point/TO/RB/FTR differential over a 100-possession range would become “significant enough” to potentially drive the outcome of a game. So for example, if you shoot +2% eFG better than your opponent over 100 possessions, that translates to 4 points which the other team would have to overcome in some other way (say – by dominating the offensive boards).
03/15/2014 at 12:45 PM #46483ParticipantVaWolf,Thank you for fixing that table.
Looking at the last 2 nights by the same criteria:
The Miami game was a toss-up, but our clear advantage in TO% would suggest a win.
The Syracuse game would chart as a ‘should loss’ as they held the advantage in 3 factors… But similarly we had a very clear advantage in eFG% where their 3 advantages were much closer to being washes. But still… That one could have gone the other way.
03/17/2014 at 7:14 AM #47204StateFans
KeymasterBTTT because this is great work
-
AuthorPosts
- You must be logged in to reply to this topic.
