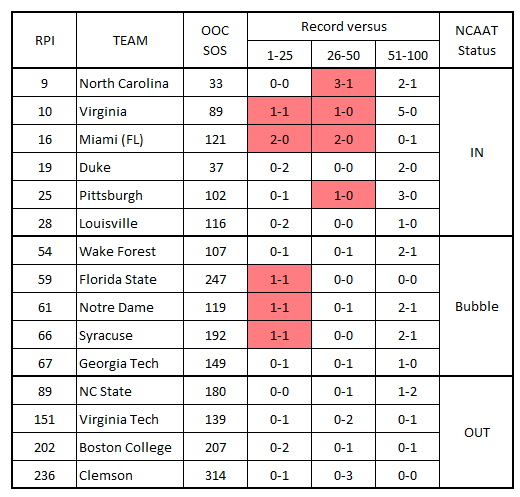
Welcome to 2016 and one of my favorite days of the year…college football on the tube all day long and my first college basketball post of the year. Along with ringing in the New Year, Jan 1 nominally marks the transition from the out-of-conference schedule to the conference portion of the regular season. So let’s start out with a summary table with data from espn.com.

RPI and NCAAT Status
Let’s back up for a minute and discuss why we care about the Rating Percentage Index (RPI) ranking and how that ties into an at-large bid to the NCAAT. For those that have been through these issues a number of times, feel free to jump down to where this year’s discussion picks up.
The RPI calculation was developed for use by the NCAAT Selection Committee on Selection Sunday. The key question that the Selection Committee has to resolve is how to evaluate a 26-3 mid/low major school versus one from the middle of a power conference. Thus the RPI calculation was born.
Now the RPI is not blindly used to fill the March Madness brackets. Rather it is just one tool that is used by the Selection Committee. Their basic philosophy has always seemed to be one of letting good teams prove that they deserve that title by beating other good teams. So 27 wins against a weak schedule is not worth nearly as much as a 18 win season against a tough schedule that also includes wins against good teams.
By looking at the results of the Selection Committee decisions over a number of years, I developed simplistic criteria to evaluate where teams fall with respect to an at-large selection. In summary:
RPI 1-39 – IN (as long as they have a .500 or better conference record)
RPI 40-69 – Bubble
RPI 70+ – OUT
Simple math says that 10-15 teams with bubble RPI results will receive at-large bids. We’ll make our choices from the Bubble based on a minimum of 2-3 wins against teams in the RPI Top 50. That should explain why I highlighted Top 50 Wins in Nov/Dec.
So what exactly is the RPI? It is a calculated number combining:
- Teams adjusted winning percentage (Road win/Home loss = 1.4; Home win/Road loss = 0.7; neutral wins/losses =1.0)
- Opponents’ winning percentage
- Opponents’ Opponents’ winning percentage
Now many people waste time complaining about “weaknesses” in the RPI. But since the RPI is not blindly used to fill the brackets, these arguments miss the main point. The main points that we should look at are:
- Were the best teams chosen for the NCAAT?
- Are the results consistent from one year to the next?
Now there will always be arguments about what defines the “best teams”; especially when you come to the final few spots. The most common mistake that most people make (and especially the media talking-heads) is that they develop their own definition of “good” instead of looking at what the Selection Committee has historically used make their selections.
That’s enough about the nuts and bolts of the NCAAT selection process for now. I’m sure that we’ll have plenty of opportunities to add to the RPI discussion during the remainder of the regular season.
OOC Results
Here are a few things that stood out to me during the OOC schedule (other than State’s poor results to date)
Based on today’s calcs, this is Gottfried’s weakest OOC schedule since he has been at State. The OOC SOS rankings will change constantly through the season, but I do not expect this fact to change. There is no way to know if this weak schedule was intentional or not, but based on his past schedules I suspect that it was not. In any case, the schedule is what it is and State’s results against that schedule are as disappointing as the SOS.
In 2006, Jim Larranaga took George Mason to the Final Four. But it took 5 years after that before a major school hired him away. Every time that I see Miami having a good year, I wonder how many AD’s wish that they had given him more consideration during their last coaching search. Since joining the ACC, Miami went 43-69 in conference games under Frank Haith and 41-29 under Larranaga along with a conference title in 2013. But surprisingly enough, that year was the only time that Larranaga took Miami to the NCAAT. I haven’t seen Miami play this year and look forward to seeing if they can maintain their position in the top third of the conference.
I caught the end of the UF/FSU game and I’m always surprised when FSU pulls out a good road win. I’m not a big Leonard Hamilton fan, but that win along with UVa over Villanova are probably the ACC’s best two wins so far this year. Time will tell if FSU can build on that win over Florida or not.
Once again Clemson shows up with an embarrassing OOC schedule. On the other end of the spectrum, both UNC and Duke have their normal good OOC schedules. While not super-strong, both Jamie Dixon and Buzz Williams made dramatic improvements in their respective OOC schedules. If nothing disrupts the master plan, I’ll have an entry at the end of the regular season to summarize the final OOC schedule rankings.
Master ACC Schedule

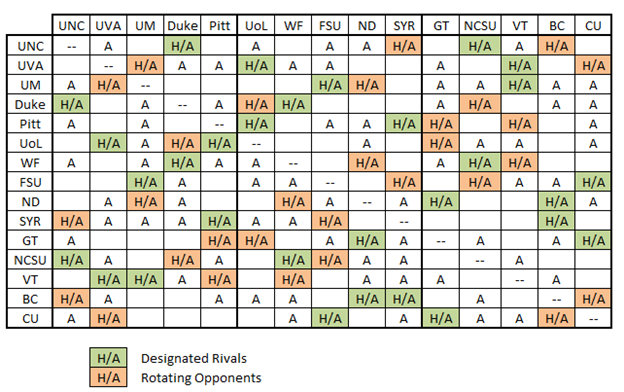
Note: To determine where a given game is played, read along the rows. For instance, UNC plays UVA in C’ville.
I’ve seen a number of comments concerning the number of ACC teams that will make the NCAAT considering that the ACC is “weak” again this year. But since the conference schedules are not balanced, the overall conference strength won’t have much (if any) effect on which side the bubble teams ultimately fall on. What will matter for the bubble teams is their WINS against the top teams, not the conference strength.
Now this is probably way too early to be ranking conference schedules, but there are still some interesting observations to make:
Louisville and VT look to be heading for the toughest schedules with three home/home matchups against what currently ranks as the top third of the conference. It also looks like Pitt may end up with the easiest conference schedule.
State’s schedule looks like it will end up well above the middle, probably in the top third of the conference. It would be nice if State could swap some home games against the bottom teams against the top, but once again, it is what it is.
Miami has among the best conference schedules since it plays most of its games against the bottom third on the road and most of their games against the top half of the conference are at home. Of course we need to determine whether or not an average attendance of 5,111 actually produces much of a home court advantage.
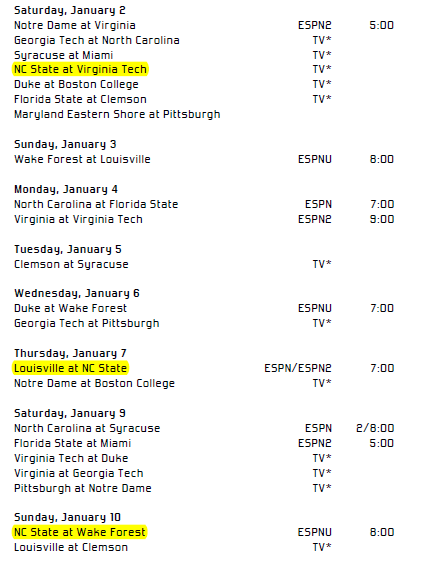
Upcoming Games

CONCLUSION
It seems like Al Stewart provides as good a preview for State fans as anyone:


