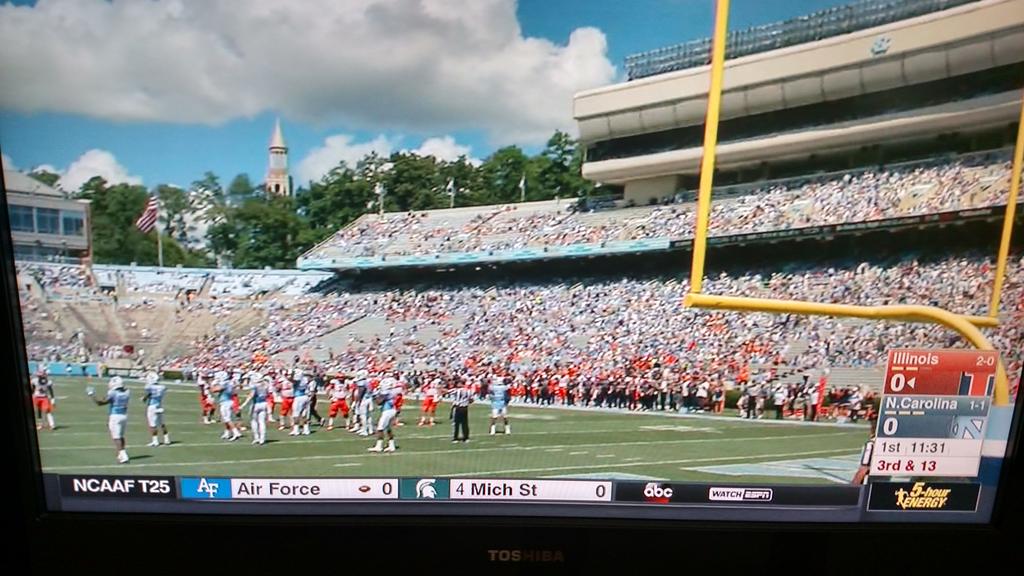
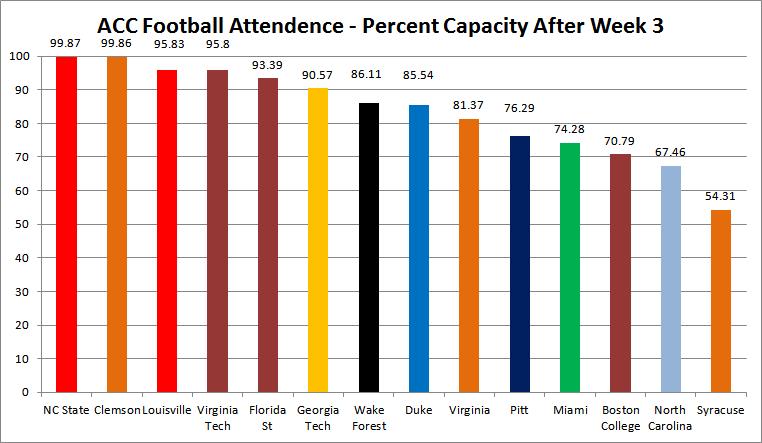
With the recent attention to the amount of visible aluminum at a couple of local stadiums as well as discussion about the decline in college football attendance, I thought I’d take a look at some early season ACC attendance numbers.

Some observations:
Compared to percent capacity from the 2014 season, attendance is down 23% at Syracuse, 19% at North Carolina, 7% at Boston College and 6% at Florida State. Attendance is up 5% at State and Duke, 18% at Virginia, 13% at Pitt and 4% at Miami. Everybody else is within a percentage point or two from last year.
State and Clemson lead the conference in percent capacity despite not playing a Power 5 opponent at home.
While State can brag that we (barely) lead the ACC in percent capacity, it would be fair to point out that Clemson does lead the ACC in average attendance.
Four of the bottom 5 schools in percent capacity are former Big East schools. However, 2 of the top 4 are also former Big East schools.
Wake has only played one home game vs Elon and did a better job filling up their stadium than half the conference.
Syracuse is dead last in the conference at just over 50% capacity. Why has Syracuse dropped off so much? Donovan McNabb wasn’t that long ago was it?
That light blue school down the road comes in at #13 and their stadium is barely 2/3 full. Plus it’s interesting that they are only school where their average attendance is a nice round number. It’s almost like they don’t report their attendance accurately. Which is so out of character, they would never lie, cheat and steal over there.
If you’re curious, Cincinnati leads the nation in percent capacity at 110.30% and Michigan leads in average at 109,167. Eastern Michigan is at the bottom of both rankings at 18.11% and 5,469.
And of course, the season is still early (hence the “Early Season” in the title)
#1 – NC State
Percent Capacity: 99.87%
Average: 57,526
Opponents: Troy, Eastern Kentucky
Power 5 Opponents: 0
Final 2014 Pct Capacity: 94.47%
#2 – Clemson
Percent Capacity: 99.86%
Average: 81,384
Opponents: Wofford, Appalachian St
Power 5 Opponents: 0
Final 2014 Pct Capacity: 100.31%
#3 – Louisville
Percent Capacity: 95.83%
Average: 52,708
Opponents: Houston, Clemson
Power 5 Opponents: 1
Final 2014 Pct Capacity: 96.31%
#4 – Virginia Tech
Percent Capacity: 95.80%
Average: 62,875
Opponents: Ohio St, Furman
Power 5 Opponents: 1
Final 2014 Pct Capacity: 93.18%
#5 – Florida St
Percent Capacity: 93.39%
Average: 76,864
Opponents: Texas St, South Florida
Power 5 Opponents: 0
Final 2014 Pct Capacity: 99.89%
#6 – Georgia Tech
Percent Capacity: 90.57%
Average: 49,816
Opponents: Alcorn St, Tulane
Power 5 Opponents: 0
Final 2014 Pct Capacity: 88.22%
#7 – Wake Forest
Percent Capacity: 86.11%
Average: 27,126
Opponents: Elon
Power 5 Opponents: 0
Final 2014 Pct Capacity: 86.38%
#8 – Duke
Percent Capacity: 85.54%
Average: 29,034
Opponents: NC Central, Northwestern
Power 5 Opponents: 1
Final 2014 Pct Capacity: 80.41%
#9 – Virginia
Percent Capacity: 81.37%
Average: 50,041
Opponents: Notre Dame, William & Mary
Power 5 Opponents: 1
Final 2014 Pct Capacity: 63.94%
#10 – Pitt
Percent Capacity: 76.29%
Average: 49,969
Opponents: Youngstown St
Power 5 Opponents: 0
Final 2014 Pct Capacity: 63.08%
#11 – Miami
Percent Capacity: 74.28%
Average: 48,524
Opponents: Bethune-Cookman, Nebraska
Power 5 Opponents: 1
Final 2014 Pct Capacity: 70.10%
#12 – Boston College
Percent Capacity: 70.79%
Average: 31,502
Opponents: Maine, Howard, Florida St
Power 5 Opponents: 1
Final 2014 Pct Capacity: 77.01%
#13 – North Carolina
Percent Capacity: 67.46%
Average: 42,500
Opponents: NC A&T, Illinois
Power 5 Opponents: 1
Final 2014 Pct Capacity: 86.77%
#14 – Syracuse
Percent Capacity: 54.31%
Average: 28,244
Opponents: Rhode Island, Wake Forest, Central Michigan
Power 5 Opponents: 1
Final 2014 Pct Capacity: 77.78%


You must be logged in to post a comment.