As we all know, the ginormous conferences have led to a situation where teams are technically in the same conference, but hardly ever play each other. This is worse in football, where you only play teams in the other division about twice per decade (except for your designated rival). In football, the difficulty of your conference schedule is driven mostly by the strength of your division. In basketball, the schedule difficulty is driven by your two defined rivals PLUS the other two teams that you play a home/home series with.
We have been tracking schedule difficulty here ever since the ACC expanded to 12 teams. Last year, I used the approach of totaling the wins of the four opponents that each team plays twice and using that total to rank the difficulty of the ACC schedules. This system has the advantage of simplicity (relatively speaking) with very few disadvantages. The chief disadvantages that I see in the system are:
- Teams at the bottom “give” their opponents more wins and thus their schedule will tend to rise in difficulty.
- There is no consideration given to where you play a particular opponent.
The first disadvantage is easy to avoid because we won’t attempt to draw any meaningful conclusions between the relative difficulty between say UVA’s schedule and someone at the bottom of the conference. The comparisons we’re interested in are those between the teams at the top of the conference and in those teams mired amongst the Mess in the Middle. Also, we’re not interested in slight differences between schedules. We’re looking for big differences that might have had significant differences in the conference finishes.
There might be some system to adjust schedule difficulty based on game location…but I haven’t really given it much thought or investigation. The current technique takes more than enough time as it is. Frankly, if I wasn’t interested in the results, I wouldn’t spend this much time just to have another analysis entry on the blog.
To illustrate the process, let’s take the winners of the easiest and hardest conference schedules and see how their results were tabulated:
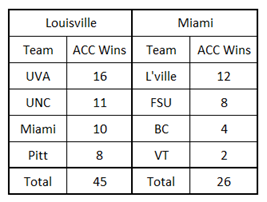
It doesn’t take more than a few seconds to see how much difference the semi-random conference scheduling can have. So here is the entire conference breakdown in both tabular and graphic formats:
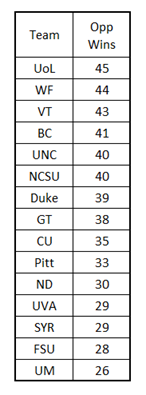
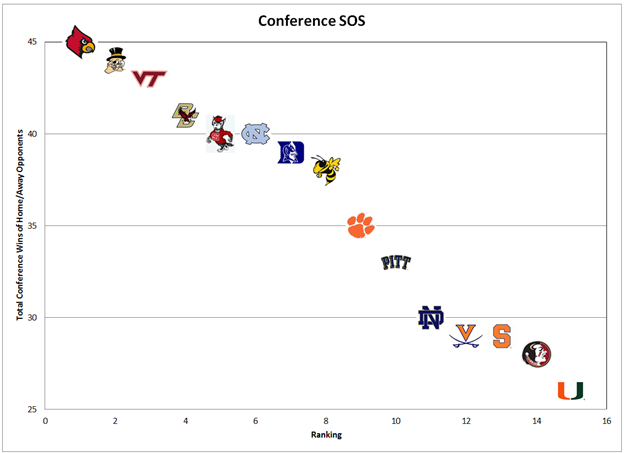
This technique has an inherent error-trapping component. Since it is theoretically possible for every team to finish with a 9-9 record, you can calculate the total number of conference wins that you should get when you total all of team’s H/A opponents (15*9*4=540). This error-checking system will hopefully catch any typos but there is always the risk of cancelling errors. If you find one, then let me know in the comments.
Now let’s take a closer look at the master conference schedule and see what stands out:
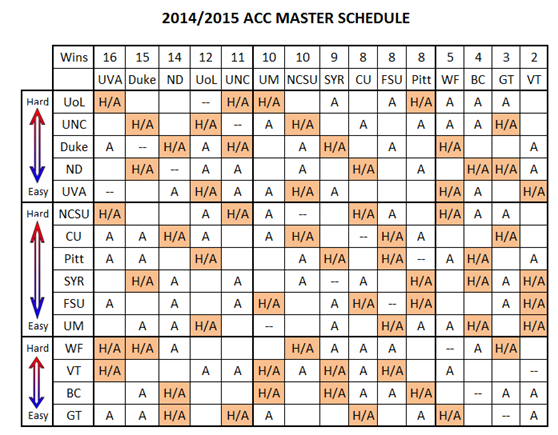
Notes of clarification:
1) Read along the rows when you try to figure out where a particular game was played. For instance, Duke played UVA in C’ville.
2) When dividing the conference into three tiers, I do not have pre-set criteria that I use each year. But between conference wins and RPI, the above splits seem reasonable to me.
3) The “Hard-to-Easy” transition in each group was based on the math presented earlier. I’ve looked over the rankings and they all are defendable. If someone was argumentative (as hard to believe as that is), you could take exception over the ranking between say ND and UVA…but issues that small simply fall beneath my give-a-shit quotient.
TRIVIA TIME
No one played more than two teams at the top of the conference or two teams at the bottom of the conference.
FSU was the only team that didn’t have two games against anyone in the top third of the conference.
L’ville, VT, and BC didn’t have two games against any team that played on ACCT Tuesday.
Unsurprisingly, the teams that played on ACCT Tuesday all rank in the top-half of the conference in schedule difficulty.
Last year, UVA had the easiest conference schedule and they’re in the bottom third this year. Miami has the easiest schedule this year and was in the bottom third last year.
WF has the second most difficult schedule this year and had the toughest last year.
ND has GT and BC as its two defined rivals, so it isn’t surprising to see them near the bottom. However, they tied for fourth most difficult last year.
Duke, UNC, and State all ranked in the top-half in schedule difficulty both this year and last.
State’s schedule ranked 7th last year and tied for fifth this year. (I didn’t go back to double-check, but I don’t remember a year when State came up in the bottom-half of schedule strength.) When I first put the matrix together, I expected State to be closer to the middle…but Clemson worked up to nearly .500 in conference which boosted State’s schedule difficulty.
HOME/AWAY DIFFERENCES
As I was looking over the matrix, the difference between Clemson’s and State’s schedules stood out to me. Let’s summarize their home games against the three levels in the conference:
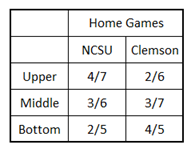
Looking at the graph or table of schedule difficulty, Clemson’s schedule ranks just below the middle in difficulty. But upon closer examination, it is not a desirable schedule for a team amongst the muddled middle. No one fighting for a spot on the NCAAT bubble wants to “waste” their home games against the bottom of the conference.
2015/2016
As I expect most already know, State has UNC and WF as its two defined rivals. Next year’s schedule has already been announced and State will have:
H/A: UNC, WF, Duke, FSU
Home: Miami, GT, Clemson, L’ville, BC
Away: UVA, VT, Pitt, SYR, ND
So we should expect State’s schedule to be in the upper-half of the conference in difficulty once again. Click here for the rest of the conference.
CONCLUSIONS
The conference is too big.
10 teams is the maximum size where round-robin schedules in football and basketball are practical. A 12 team conference would be acceptable if you played 9 conference games in football and 18 games in basketball. But I didn’t put this entry together just to make a “Master of the Obvious” conclusion.
This entry isn’t about conclusions as much as just understanding the impacts of unbalanced scheduling. There is no way to eliminate the issues illustrated above, but you could randomize the effects. But the desire to protect some inherent rivalries has at least two unforeseen consequences:
– You have to create “unnatural” rivalries to balance the natural ones
– Creating rivalries will tend to bias certain team’s schedules towards the top or the bottom of the conference.
But the main conclusion that coaches and AD’s need to draw is that you can no longer count on a tough ACC schedule to cover a piss-poor OOC schedule. At least that’s one problem that State fans don’t have to worry about.


