Everyone says their goal is to “Win It All Baby!!” but do they really have a team that can have their One Shining Moment? This will be a 3 Part Series taking a look at what all National Championship Teams have in common between 2002 and 2014. Is it talent level? What about the systems they run? How about tempo? Are they full of upperclassmen? We’re going to take a look at the numbers, lay them out and then see where they lead us. There is no predetermined outcome to this, so please don’t go screaming about Anti-this, Pro-that stuff. I started this endeavor to find out what will it take for NC State to win its third National Championship (or any team to win a title) and then evaluate where NCSU as a program stands today. In this first part we are going to take a look at various National Champions from present back to 2002 (that’s how far back my data goes) as well as the Final Four members of those seasons because the Cinderella’s have usually been weeded out by then. Let’s get started…
NOTE: Data is the final numbers from Kenpom.com. Since beginning this analysis KP has included both final and pre-tourney numbers in his historical data.
First let’s look at the National Champions from 2002-2014.
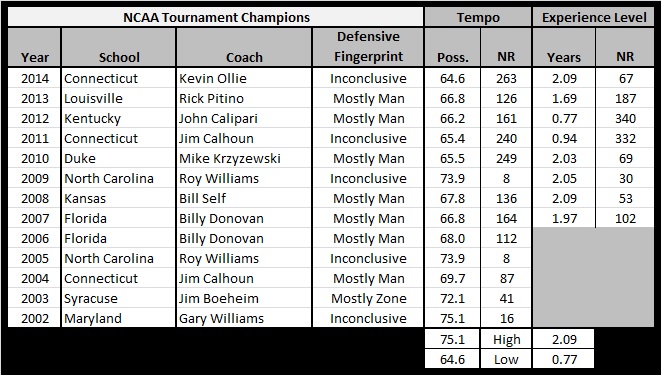
As we can see by the table, over last 13 seasons, there have been:
• 9 Different Schools
• 10 Different Coaches
• 7 Defenses that are Mostly Man, 1 Mostly Zone, the rest too close to tell
• Tempos have been “Watching Grass Grow” Slow all the way to Run’N’Gun Fast.
• Experience Level has ranged from Diaper Dandies to Retirement Home.
What does this tell us? It tells us that the style of play and the experience level doesn’t matter. The number of coaches tells us it’s not a small handful winning it every season. Whether it’s Man or Zone it doesn’t matter.
So what does matter? Well the object of the game is to outscore your opponent. The best way to outscore your opponents is to have a good offense AND a good defense. If we’re going to compare different teams over multiple years we need to compare apples to apples and get it down to a single number to find the value of each team. I call it ODS, or the Spread. ODS is simply the difference between a team’s Offensive Efficiency (OE) and its Defensive Efficiency (DE). For those who aren’t familiar with Offensive and Defensive Efficiency it’s simply the number of points scored per 100 possessions. By using efficiencies we eliminate the silly Apples to Buicks comparison of Points per Game between different teams that play at different tempos. Efficiencies allow us to compare the offenses and defenses of different tempo teams evenly. ODS takes it ones step higher to compare the teams while using both efficiencies. Please Note that Ken Pomeroy states that his adjusted efficiency numbers are not designed to determine how good a team is for the season but how good they are at that moment; that’s why I feel comfortable using the final numbers when talking about the NCAA Tournament.
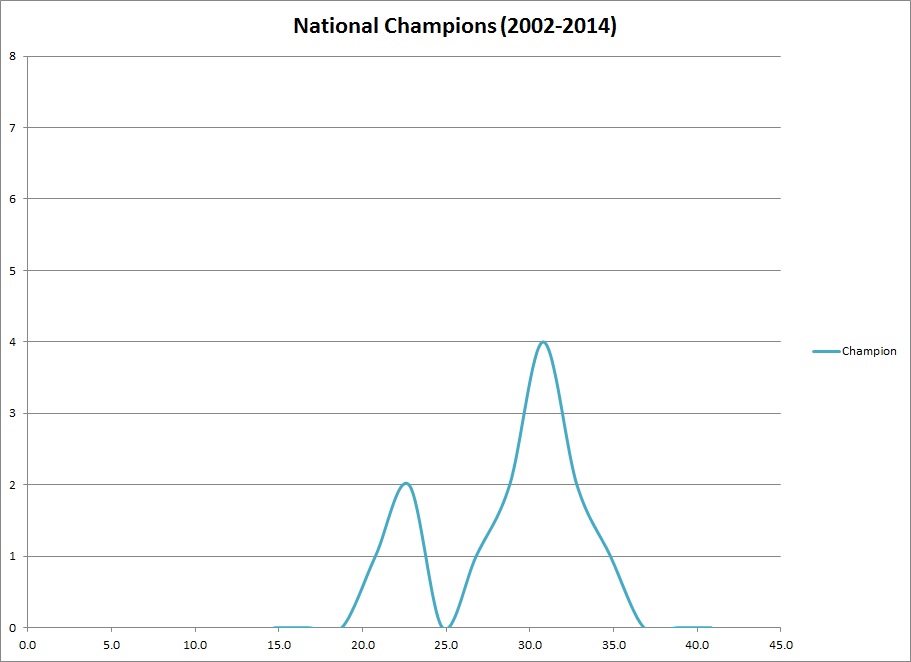
Using a bell curve to group the population of National Champions we see there have been a small group (3) with an ODS range of 20-25 but a much larger group of teams (10) with an ODS range of 25-35. This tells us that while it’s not impossible to win the national championship with an ODS below 25 the odds are ever in your favor to be above it.
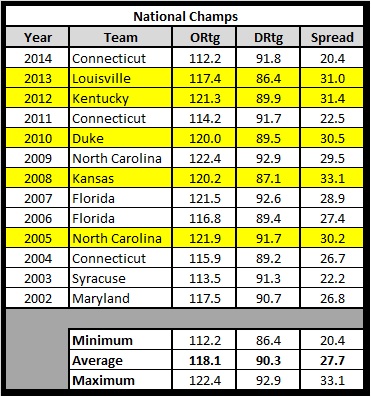
Breaking down each team we see their final Offensive and Defensive Efficiencies and the ODS. UConn is 2 of the 3 teams to win with a sub-25 ODS, the latest being in 2014 with the lowest ODS in the last 13 seasons. I highlighted the teams with a +30 ODS and here’s why, since 2002 only 3 out of 8 teams with an ODS of 30 or more has failed to win the National Title:
1. Duke 2002 (S16) – Lost to Runner Up Indiana.
2. Illinois 2005 (Runner Up) – Lost to UNC who also had +30 ODS.
3. Ohio State 2011 (S16) – Lost to Final Four Kentucky.
Looking back at the final numbers for all teams, if a team finishes with an ODS +25 you have a 25% chance in winning the championship where if you expand to include the 3 “Cinderella’s” in the 20-25 range your chances decrease to only 8%.
When I say “Cinderella’s” I mean it in today’s environment. The championship teams’ start the NCAAT in the Top 5 of ODS Rankings with the lone exceptions having been:
• The Bronze Lucky Horseshoe Award goes to the 2011 Connecticut Huskies (#3 Seed) who started the NCAA Tournament #13 (ODS Ranking) and finished #8.
• The Silver Lucky Horseshoe Award goes to the 2003 Syracuse Orangemen (#3 Seed) who started the NCAA Tournament #18 and finished #6.
• The Golden Lucky Horseshoe is awarded to the 2014 Connecticut Huskies (#7 Seed) who began the NCAA Tournament in a three way tie for #25 with an ODS of 16.6 and finished with 20.4 at #13.
Just so I’m clear, I’m not saying you MUST have an ODS of 25 or more to win the championship but it does greatly increase your chances. The 2014 UConn Huskies entered the tournament with only a 4% chance of winning the belt.
DIGGING DEEPER
The OE and DE give us an idea of where you need to be shooting for in order to be a national champ. The range of the OE is larger than the DE but one thing is clear, a very strong Offense AND Defense are necessary.
If a strong Offense and Defense are necessary then what are most National Champs doing to make them so good?
Let’s break down both sides into the Four Factors: Effective Field Goal Percentage (eFG%), Turnover Percentage (TO%), Offensive Rebounding Percentage (OR%), Free Throw Rate (FTRate).
Effective field goal percentage is like regular field goal percentage except that it gives 50% more credit for made three-pointers.
Turnover percentage is a pace-independent measure of ball security.
Offensive rebounding percentage is a measure of the possible rebounds that are gathered by the offense.
Free throw rate captures a team’s ability to get to the free throw line.
Dean Oliver has already taken the time to rate the value of each of these Four Factors as it applies to the NBA:
1. Shooting (40%)
2. Turnovers (25%)
3. Rebounding (20%)
4. Free Throws (15%)
Does this translate back to the NCAA? Let’s take a look at the National Champs and compare their Four Factors against the NCAA Average for their season.
Let’s look at the Offense first:
The table is too big to fit in the article so please click here.
With the exception of the Cinderella’s each team is very efficient on offense, even 2 of the 3 Cinderella’s are pretty good but aren’t dominate in a couple of factors, just slightly above average. One thing of note is the 3 seasons where the champion was below average in FTRate all come from the same team, Connecticut. Here is a list of things that stick out to me that every team needs to focus on:
1. Don’t have an Adj. OE below 115. Below 115 and you need a miracle run.
2. Shoot the ball really well. DUH!!! Try shooting better than 52% eFG and you’ll be okay.
3. There’s not a big range in TO% but just better than average okay? The fewer possessions you give away the better you’ll be.
4. You must be strong at Offensive Rebounding, there’s just no way of getting around that. This is where I feel TO% and OR% is even in college basketball.
It doesn’t matter if you like to shoot it more from beyond the arc or take it inside more, either way works IF you can score effectively. In the end, fast tempo, slow tempo, shooting outside, shooting inside, whatever style you want to play it doesn’t matter. What does matter is being efficient at whatever it is you do.
Now the Defense:
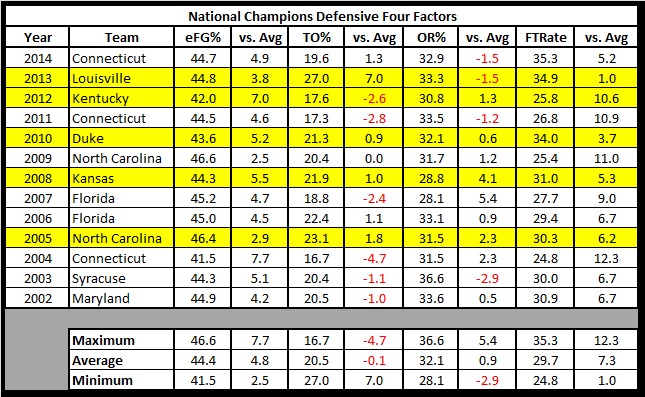
Using a small sample size of just the last 13 National Champions we see a really good shooting defense is necessary for everyone. Only UNC has won with less than 3% below the national average. On average though, you want an eFG% of less than 45%.
Looking at the remaining 3 factors the National Champions have hovered around the national average in TO% and OR% but are strong at FTRate. Is this a function of favorable calls or just being so much better than others they don’t give their opponents an opportunity at free throws in comparison to their shooting? I think we need more teams to compare to find out how much the values translate to the NCAA. We’ll revisit this in Part 2 when we expand to include other rounds of the NCAA Tournament. One thing I do see in the champions list is if they are “weak” in one factor they make up for it in another factor and the majority make up for average TO% and/or OR% by not fouling.
SUMMARY
It doesn’t take a particular style of offense or defense in order to win the national championship. It doesn’t take a team full of upperclassmen either. It takes a coach who emphasizes the need for a strong efficient offense and an even stronger efficient defense to put you in the best chance of winning it all. Yes I know this isn’t earth shattering, breaking news where needing a strong offense and a strong defense to win but what I’ve laid out for you is a breakdown of those teams to show what they have in common in order to become a champion. If you shoot for the averages: ODS = 28, OE = 118, DE = 90 you’ll put yourself in a much better position (if you are even in a position) to win the title. Develop the defense through tough defensive shooting, eFG% < 45%, and getting really good at one other factor while being at least average in the other 2 factors. The style and system a coach uses doesn’t matter, simply attaining those numbers do. Let me reiterate, I’m not saying you can’t have a Cinderella pop up and win it (UConn 2014 & 2011 as well as Syracuse 2003) on occasion but if you’re serious about winning a national title then Hope (hoping you get hot for 3 weeks, hoping you can just outscore them on offense) isn’t a viable strategy.


