ACC Bubble Update

In case you’re wondering, my Minion pic has nothing to do with anyone here at SFN. The fact that a 15 min drive home after lunch took almost an hour should explain it. Oh and I forgot to mention…there was less than ½ inch of snow on the ground at that time. So for everyone stuck in the snow, keep safe and keep warm. And remember, the idiots have us out-numbered.


THE BUBBLE IS WEAK THIS YEAR

In any event, this week’s update is going to focus heavily on the NCAAT bubble. In last week’s entry, I called the Bubble “weak” without giving any explanation or reasoning, so let’s start with that. Remember that what we usually call “RPI” is actually just a ranking. The actual Rating Percentage Index (RPI) is calculated based on your team’s adjusted winning percentage (home losses and road wins count more), your opponent’s winning percentage (with the games against you removed from their record), and your opponents’ opponents’ winning percentage. So here is a graph that correlates Monday morning’s RPI calculations from CBS with the resulting ranking.
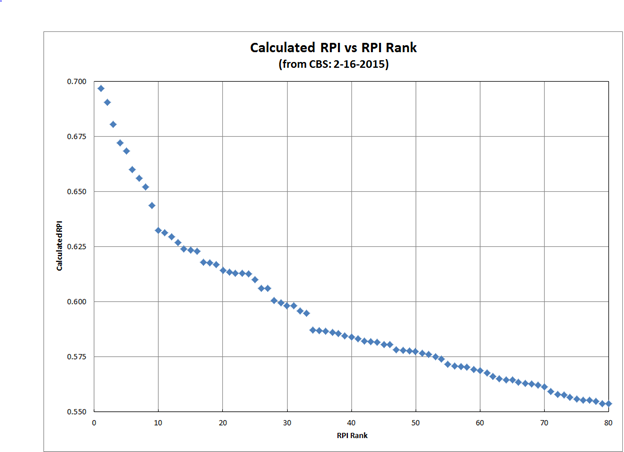
 

There are a number of conclusions that can be drawn from this graph, but let’s focus on the bubble end of the graph. Starting with #34, there is very little difference from one team to the next. Thus when you lose, you will drop and when you win, you’ll rise pretty quickly. This is what I meant by weak.

It also means that there won’t be much difference between the last four IN the NCAAT and the first four OUT…which has been a noticeable trend over the last several years. This fact also ties into an entry I did last year on whether or not parity exists in college basketball. While I argued that parity does not (and will not) exist at the top of the college basketball world, this graph certainly lends credence to parity at the next step down.

To further illustrate why a win or a loss results in such large moves, let’s look at State’s current portion of the rankings and the delta between one team and the next:
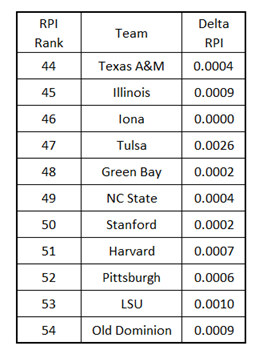
To be clear, the “Delta RPI” shows how close each team is to the one ranked one spot higher. So it should be obvious that the difference between a win and a loss will usually mean multiple positions in the ranking. This small Delta also means that no bubble team is truly IN or OUT even this late into the season.

Hopefully this discussion will also clear up a question that I get nearly every year….How much will State’s “RPI” change if such and such happens? Even if you assume an outcome for a number of State’s games, you cannot calculate how much the ranking would change unless you also assume the results of a dozen or more other teams. Just remember, winning is always good and losing is always bad…and let’s leave the math to someone that is getting paid to do it.

As we move onto our weekly summaries, I’ll highlight a few more examples of a weak bubble.


ACC UPDATE

Here are the ACC teams sorted on RPI Rankings (from CBS after games played on Sunday):
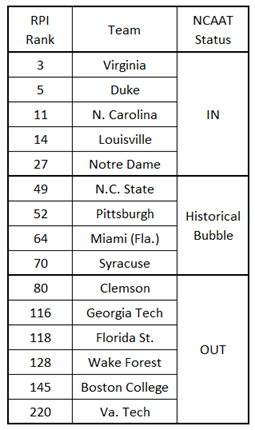
 

Miami lost mid-week and their game at BC got postponed yesterday, while State and Pitt both won over the weekend. So both winning teams have moved above Miami (at least for the time being).

Syracuse continues their downward spiral (as predicted).

Clemson’s RPI is lower than any team ever to receive an at-large bid, but let’s look at their position on the Dance Card:
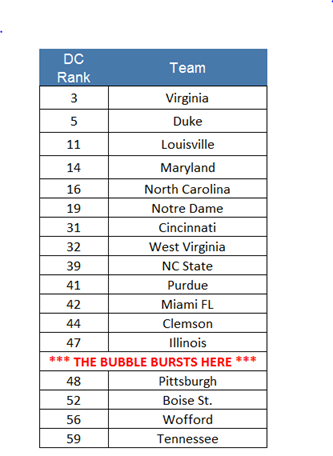
 

So we see that Clemson’s resume (even with a horrid RPI) is good enough to sneak several spots above the calculated burst point. I think that this also shows how weak the Bubble is this year.

For State’s OOC wins, BSU is still hanging around and Tenn looks to be fading. Go Broncos!!!

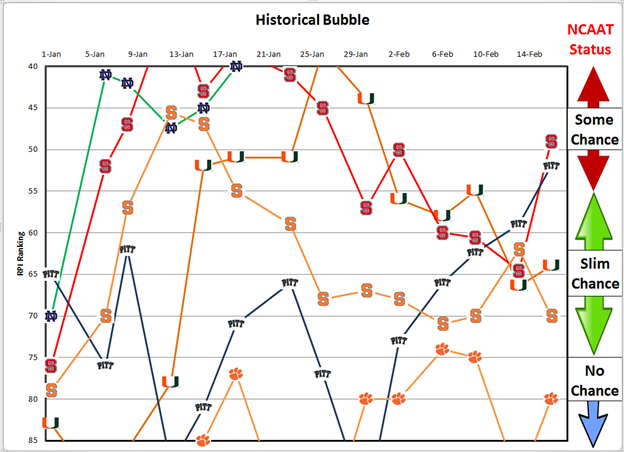
Time for the RPI trend graphs:
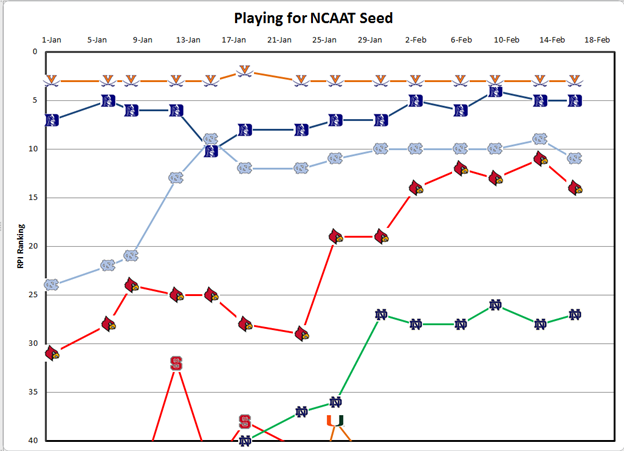
More examples of a Weak Bubble:

Mid-week, Syracuse jumped 8 spots with a road win against BC. (BC !!!!)

Pitt moved up three spots with a LOSS at Louisville.

Miami moved up two spots without even playing.

I think that I’ve presented enough data that I can quit beating the “Weak Bubble” drum for now. The bottom line is: win and you are virtually guaranteed to move up. So let’s take a little closer look at the ACC Bubble Teams:


PITT

Through a fortunate bit of scheduling, Pitt had four of the last five games at home. By playing well, they won all four home games, including key victories against UNC and ND. This good streak of BB gives this Pitt team more Top-50 wins that last year’s team got all year. However, the Dance Card still shows them one spot below the burst line. So they need to keep winning and here are their last regular season games:

Feb 16    @No.2 Virginia

Feb 21    @Syracuse

Feb 24    Boston College

Mar 1    @Wake Forest

Mar 4    Miami (Fla.)

Mar 7    @Florida St.

Even with 4 of the last 6 on the road, Pitt should have an NCAAT bid wrapped up before the ACCT starts. Anything less would have to be termed a huge disappointment.


MIAMI

Including Monday afternoon’s win over BC gives Miami a 2-4 record over the last six games and a significantly weakened position versus the Bubble. While they are still above the calculated burst line, losses to GT, FSU, and WF should have Canes fans concerned. The do have the big road win at Duke along with two victories over fellow Bubble teams (NCSU and Illinois), so they are not in bad shape….but need to pick up the pace.

I have my ACC Strength of Schedule spreadsheet up and running and it appears that Miami will end up with one of the easiest conference schedules this year. So any team that wins in Durham, yet fails to make the NCAAT with an easy conference schedule would have to be considered “under-performing”.

Here’s Miami’s remaining regular season schedule:

Feb 18    Va. Tech

Feb 21    @No.12 Louisville

Feb 25    Florida St.

Feb 28    No.15 N. Carolina

Mar 4    @Pittsburgh

Mar 7    @Va. Tech


This stretch of games looks tougher than the last six, so Miami is going to have to pick up the pace if they are going to lock down a bid before the ACCT.

Note that Miami’s win on Monday afternoon is not included in the RPI rankings/graph above, but is included in the ACC standings at the bottom of the entry.


CLEMSON

Clemson dug themselves a huge hole early with a weak OOC schedule (currently ranked #192) and playing horribly with losses to South Carolina (#104), Rutgers (#138), Gardner-Webb (#166), and Winthrop (#219). They do have a few good points to the season with wins against #18 Arkansas and wins against bubble teams NC State, Pitt, and LSU.

I wouldn’t want to head into Selection Sunday with an RPI ranking below what has EVER been selected before. So the Tiggers need to pick up the pace and here is their remaining schedule:

Feb 16    @Georgia Tech

Feb 21    @No.4 Duke

Feb 28    Georgia Tech

Mar 3    N.C. State

Mar 7    @No.10 Notre Dame


NC STATE

State’s road win over Louisville gives them enough “big” wins to get an at-large bid. Now they just need to get enough total victories to secure an at-large bid. So how many wins will that take?

Saying that a 4-1 record will secure a bid is as insightful as saying that water is wet. However, projecting a sure bid with results worse than that runs the risk of being overly optimistic. The bottom line is that the minimum acceptable record will depend on what everyone around State on the bubble does.

Gott hit it right when he said that State could beat anyone remaining on the schedule and could easily lose to any of them. The remainder of the season should prove interesting….and I mean that in context of the old Chinese curse.


ACCT BUBBLE

I didn’t even know that Miami and BC were playing this afternoon until I pulled up their schedule at CBS Sports. So I’ve updated the standings for the result of that game, but I’m going to publish this entry before the Monday night games are played. So here’s what we have for now:
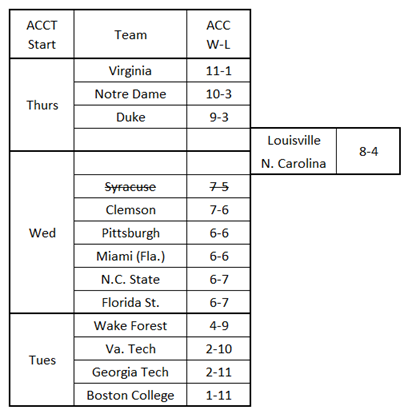


Thanks to Syracuse pulling out of the ACCT, the “States” are hanging onto a Wed start with a two-game lead over WF. But it’s also interesting to note that Clemson only has a one game lead over both of them.

Last year, everyone that started on the second day of the ACCT had a 0.500 or better conference record. FSU might hold onto their Wed Start, but I wouldn’t bet on them reaching 0.500 this year.


About VaWolf82

Engineer living in Central Va. and senior curmudgeon amongst SFN authors One wife, two kids, one dog, four vehicles on insurance, and four phones on cell plan...looking forward to empty nest status. Graduated 1982

14-15 Basketball College Basketball General Stat of the Day

Home Forums ACC Bubble Update

Viewing 25 posts - 26 through 50 (of 96 total)
  • Author
    Posts
  • #74624
    VaWolf82
    Keymaster

    The way RPI is calculated, the games you win and lose are exactly as important as the games your opponents’ opponents win and lose.

    Not true at all. I’ve torn apart the RPI calks in the past. I may have to try and find that or do a new one.

    but just last year SMU clearly should’ve been in.

    SMU fell into the same pit that has swallowed many teams and coaches that insist on scheduling an OOC schedule that was an absolute joke. It happened to VT and Seth Greenburg several times, got Herb at ASU once, and got Penn State several years ago. It’s a repeatable phenomen that has been discussed here as well as by Jerry Palm (now at CBS Sports).

    You can argue whether this is fair or not, but that is a different argument. Combine a poor OOC schedule with middle of conference regular season results and poor conference tourney performance and you will quite often end up in the NIT.

    #74626
    VaWolf82
    Keymaster

    More on SMU from last year

    According to Wellman, scheduling was the deciding factor between State as the last team in at 21-13 and SMU as the last team out at 23-9.

    “In SMU’s case, their downfall, their weakness, was their schedule,” Wellman said. “Their non-conference strength of schedule was ranked 302nd. It was one of the worst non-conference strength of schedules. Their overall strength of schedule ranked 129. That would have been, by far, the worst at-large strength of schedule going into the tournament. The next worst at large strength of schedule was 91.”

    http://acc.blogs.starnewsonline.com/41076/embattled-wake-forest-ad-wellman-makes-some-new-friends-at-n-c-state/

    Bottom line….pumping up your record by beating weak teams might impress the AP voters, but not the NCAAT Selection Committee.

    #74628
    MP
    Participant

    Not a knock against this post, as I understand that RPI is a thing that the selection committee supposedly uses to make their decisions, but posts like these always remind me how absolutely bonkers it is that we’re still using RPI to talk about which teams deserve tourney berths. It’s such a terrible, meaningless statistic, and it boggles my mind that it wasn’t phased out years ago.

    Yes. For perspective ESPN RPI has (5 loss) Kansas at #1… Over Kentucky! Maryland is a Top 10 team according to RPI… Barely Top 40 per Pomeroy.

    But knowing or assuming that RPI is referenced by the committee, I enjoy these posts.

    #74629
    wufpup76
    Keymaster

    I mean, I can go digging back through tourney snubs, but just last year SMU clearly should’ve been in.

    I can’t agree with this at all. Their non-con schedule was a complete joke by most any measure, and that is clearly defined as a huge factor when it comes to selection and seeding.

    I think VaWolf’s posts above addressing SMU from last season are spot-on. We can argue about the RPI and it’s relevance / how much it does/should factor – but aside from minor nit-picking I think each selection committee generally does a great job every season.

    The RPI gets so much attention because it’s one of the easily accessible indicators/predictors that is available. Indicator being the key word.

    If SMU and State were close in RPI at the end of conference tournament play last season, then clearly the other factors such as non-con scheduling and qualitative – not quantitative – values of independent wins/losses were weighted more than RPI. Assign any number value you want to scheduling – the committee members can still take a look at who you actually played and beat plus where you played them in order to make a qualitative, non-numbers based determination.

    SMU reaped what they sowed. I thought it was clear, and that the hand-wringing over SMU’s exclusion last season was done b/c people are always going to bitch about something. It’s kinda like Greenberg moaning about his various teams’ exclusions and the committee simply says ‘You know what you should do. Do better.”

    #74630
    xphoenix87
    Moderator

    Not true at all. I’ve torn apart the RPI calks in the past. I may have to try and find that or do a new one.

    RPI is 25% your record (with some [bad] adjustment for home/away since 2004), 50% your opponents’ record, and 25% your opponents’ opponents’ record. That’s how it’s calculated. So an individual win or loss for you has more effect than an individual win or loss by an opponent’s opponent (because there are so many more games that go into that 25%), but in cumulative, the record of your opponents’ opponents is given the same weight as your record.

    SMU fell into the same pit that has swallowed many teams and coaches that insist on scheduling an OOC schedule that was an absolute joke. It happened to VT and Seth Greenburg several times, got Herb at ASU once, and got Penn State several years ago. It’s a repeatable phenomen that has been discussed here as well as by Jerry Palm (now at CBS Sports).

    You can argue whether this is fair or not, but that is a different argument. Combine a poor OOC schedule with middle of conference regular season results and poor conference tourney performance and you will quite often end up in the NIT.

    But that’s exactly the point. I’m arguing that the system is broken, and RPI is a large part of why that is, because it weighs strength of schedule so heavily and calculates it so poorly. I think everyone on the selection committee would tell you that they’re trying to select the best 68 teams (or however many it is when you take away automatic bids). That’s their goal, to get the 68 teams that have had the best seasons. By any reasonable measure, SMU was easily one of the best 68 teams. Not just barely, but definitely. In the upper half, in fact. If the system in place is keeping them out, the system is wrong.

    Even that quote you referenced is referring to the SOS portion of the RPI. When you use RPI, SMU’s SOS was 129 (or, since all I can find now is end-of-year, post-tournament numbers, 135) according to RPI. Going by BPI, their SOS is 87, not far off from St. Louis (76), Tennessee (84), Creighton (81) and San Diego State (91), who all got at-large bids. Going by Kenpom, they were 93, again very close to teams like San Diego State and Cincinnati.

    Again, just to be clear, I’m not attacking anyone and I don’t have a problem with these posts because RPI is still being used by the selection committee. I just think it’s absolutely crazy that they are still using it.

    #74631
    VaWolf82
    Keymaster

    So an individual win or loss for you has more effect than an individual win or loss by an opponent’s opponent (because there are so many more games that go into that 25%), but in cumulative, the record of your opponents’ opponents is given the same weight as your record.

    That is true, but is not as significant as you are making it because that same factor figures into every team’s RPI. So what matters is the delta from one team to the next. So what generates a delta?
    – Better winning percentage
    – Playing in a better conference (affects both opp’s WP and opp/opp WP)
    – Playing better OOC opponents

    When you are comparing teams from the power conferences, your team’s winning percentage will produce a bigger delta than the SOS. When you get similar winning percentages, then obviously SOS is generating the difference (Thus explaining the relatively large difference between State and Clemson.)

    It has always appeared to me that the Selection Committee asks teams to prove that they are good by beating other good teams. Mid-majors like Gonzaga get that and schedule appropriately. Teams like SMU, and coaches like Herb and Seth Greenburg don’t and sometimes pay the consequences.

    So the RPI and the Selection Committee reward teams for playing and beating good teams and penalizes those that don’t. Personally, I’m OK with that philosophy.

    #74633
    packalum44
    Participant

    If we had a coach with talent commensurate to our stated goals we would all be spared the agony of this annual bubble blabber ritual.

    My only ‘hope’ this March is that Archie isn’t lured away from Dayton.

    #74634
    xphoenix87
    Moderator

    If you don’t see a problem with a rating system that is arbitrarily weighted, has little predictive value, and doesn’t incorporate margin of victory, then I guess we’re done here.

    So the RPI and the Selection Committee reward teams for playing and beating good teams and penalizes those that don’t. Personally, I’m OK with that philosophy.

    That’s fine. My philosophy is that I’d like the committee to actually reward the best teams, which is what they’re supposed to do.

    #74635
    wufpup76
    Keymaster

    I’m arguing that the system is broken, and RPI is a large part of why that is, because it weighs strength of schedule so heavily and calculates it so poorly.

    By any reasonable measure, SMU was easily one of the best 68 teams

    Again, nothing is stopping the committee from making decisions NOT based on numbers. If SMU was denied mostly due to non-conference schedule, then let’s take a look at it without quantitative data: (source)

    They went 10-2 in non-conference.

    Wins:
    TCU (“neutral” court – Dallas)
    Rhode Island (home)
    Texas State (home)
    Arkansas Pine-Bluff (home)
    Sam Houston State (home)
    Texas A&M (neutral – Corpus Christi)
    McNeese State (home)
    UIC (away)
    Texas Pan-American (home)
    Wyoming (away)

    Losses:
    Arkansas (away)
    Virginia (neutral – Corpus Christi)

    Recap: They traveled out of Texas three times in 12 games (Arkansas (L), Wyoming (W), UIC (W)). The only above average teams they played against they lost – Virginia and Arkansas.

    From this schedule and results last season what merits their inclusion? Combine this with bad losses in conference to South Florida and then Houston in the first round of the AAC tournament … the body of work is now able to be dismissed when held up to other teams and selection standards. If you’re going to have such a laughable non-conference schedule don’t lose to a conference bottom-feeder in the first round of your conference tournament.

    Is their exclusion debatable? Sure. I do not agree at all that they should have been a shoo-in for selection though. Apparently neither did the committee. Numbers are not the be-all, end-all.

    #74636
    xphoenix87
    Moderator

    Again, nothing is stopping the committee from making decisions NOT based on numbers. If SMU was denied mostly due to non-conference schedule, then let’s take a look at it without quantitative data:

    You’re entirely missing the point. Nobody is arguing that SMU’s non-conference schedule was good. Why does that matter more than their entire body of work? As I mentioned above, Wellman’s quote wasn’t just about their OOC SOS, it was that their whole season strength of schedule was so much weaker than anyone else in the field. As I pointed out, if you use better ranking systems to find SOS, it still comes in on the low end, but well within the range of many other at large teams. Their OOC SOS was bad, but not much worse than teams like Ohio State, Cincinnati, Iowa and Pitt when you use an actually competent rating system (again, remember that when you’re talking about the SOS component the NCAA references, you’re talking about SOS as calculated by the RPI formula).

    The only above average teams they played against they lost – Virginia and Arkansas.

    How are we defining “above-average” though? Tournament teams? Top 50/100 RPI? If so, you’re using the thing you’re arguing for to defend itself. In terms of national average, Wyoming is an “above-average” team that SMU beat by 8 on their home court. Rhode Island is an “above-average” team that SMU whipped by 30.

    Also, why doesn’t SMU get credit for a close loss to Virginia at a neutral site (which, I’d wager, is better than the best win of several teams that made the field)? Why don’t they get credit for not only beating the average-to-bad teams that they played, but wiping the floor with them?

    I’m not advocating that we should use only a computerized ranking system to select the teams. What I am arguing is that the ranking system we use should be better. Any of the systems out there, BPI, Sagarin, Kenpom, I don’t care which, all of them are not just better than RPI, they’re MUCH better.

    In the case of SMU, it’s not that they were kept out because people wouldn’t look at the numbers. The committee said they passed the eye test, but when they looked at the RPI and the RPI-generated SOS, they weren’t good enough. The problem isn’t that they didn’t check the numbers, the problem is that they checked the wrong numbers.

    #74637
    choppack1
    Participant

    This is actually a fun conversation.

    Me – I would like to see that kenpom and/or sagarin is better than RPI. I think the RPI is used and quite frankly it’s the primary tool used by the committee…but you should present hard data to show that the “model” used should be replaced.

    #74638
    xphoenix87
    Moderator

    Though I don’t entirely agree with the methodology he uses, this is a nice little article showing that at least a couple other systems outperform the RPI in predicting NCAA Tournament results

    The RPI is Not the Real Predictive Indicator

    There’s also a really long article here at Basketball Prospectus that talks about the history of RPI, some of its weaknesses, and some of the ways that coaches can try to game it.

    http://www.basketballprospectus.com/article.php?articleid=2451

    Lastly, you don’t really even need a side-by-side test to see which system is better. RPI is ludicrous on a conceptual level. Why is strength of schedule worth 75% of a team’s rating? Because we said so, that’s why. Why is a home game suddenly worth twice as much if you lose it? Who the heck knows? Because we said so. Everything about it is arbitrary.

    #74639
    wufpup76
    Keymaster

    You’re entirely missing the point

    Well, I don’t necessarily feel that I am 🙂 . The argument that the numbers the committee utilizes is flawed is fine – but even if we substitute any of your given suggestions a team’s selection is still subjective.

    Where your argument still uses numbers to compare and justify, I merely took numbers completely away from the decision process. The ‘eye test’ is subjective, but you still have actual on-court results to rely on. To me, it was a weak schedule with few things truly standing out that screamed ‘select me!’ – even if one feels the team passed any ‘eye test. I’m considering the entire body of work.

    How are we defining “above-average” though? Tournament teams? Top 50/100 RPI? If so, you’re using the thing you’re arguing for to defend itself. In terms of national average, Wyoming is an “above-average” team that SMU beat by 8 on their home court. Rhode Island is an “above-average” team that SMU whipped by 30.

    ^No. No numbers. Eye test and results. As for non-con, there was a clear and distinct cut line between the quality of Virginia and Arkansas and the quality of the other teams played in the non-con schedule. Virginia was a 1 seed in the NCAA, Arkansas was in the NIT, Wyoming was a middling mid-major (18-15) that played in the CBI, and Rhode Island was 14-18. Neither Wyoming or Rhode Island was above average.

    #74640
    VaWolf82
    Keymaster

    If you don’t see a problem with a rating system that is arbitrarily weighted, has little predictive value, and doesn’t incorporate margin of victory, then I guess we’re done here.

    The RPI formula has been adjusted several times over the years, so “arbitrary” isn’t really accurate. You’ve mentioned several other formulas that you claim are better. While it’s obvious that they’re different, it’s not obvious that they are in fact better.

    I don’t want a “formula” that claims to be predictive. The job of the Selection Committee is to evaluate what has already happened, not predict the future.

    Using margin of victory is a double-edged sword as discovered during the BCS era. Plus there are many games where the final margin is not indicative of how close the game was for 39 minutes…then the fouling and missed 3-pt shots skew the final margin.

    #74641
    Texpack
    Participant

    RPI is ONE component that the committee considers.

    I saw references to “Body of Work”. Jay Bilas says every year that this is about “Who did you play and who did you beat?” I really like that description. The RPI attempts to quantify the RELATIVE strength of the Who’s. That’s all it really does. The committee relies on eye witness testimony from people who actually watch these teams during the year so the “eye test” is employed as well. The committee has been very open about what teams need to do to qualify. The only teams that can squeal in my view would be smaller schools that can’t get any P5 schools to play them. I’m not sure they really exist because if you are a pretty good smaller school, coaches like Gott will schedule you.

    The other thing I would note is that EVERY bubble team has an issue or six. That is why they are on the bubble. If we don’t get in, we will need look no farther than ND, Wofford, and Clemson.

    #74643
    VaWolf82
    Keymaster

    Also, why doesn’t SMU get credit for a close loss to Virginia at a neutral site

    Missed this earlier.

    How close do you have to be to be considered a close loss?
    Is a two-point loss worth half of a one-pt loss?
    Is a 3-pt loss worth one-third as much?
    Does a bad loss offset a close loss?

    To me, a loss is a loss. I’m not into supporting moral victories…that show up as losses in the record book.

    #74644
    wufpup76
    Keymaster

    Just in case anyone misses / missed it – xphoenix has a post above which had gotten trapped in the spam filter. I didn’t notice it until just now.

    The post has a couple of links for anyone interested …

    General FYI – I think posts containing more than one hyperlink are tagged as spam. I’ll try to keep an eye for more posts falling into the spam filter in other threads.

    #74645
    pakfanistan
    Participant

    Just in case anyone misses / missed it – xphoenix has a post above which had gotten trapped in the spam filter. I didn’t notice it until just now.

    The post has a couple of links for anyone interested …

    General FYI – I think posts containing more than one hyperlink are tagged as spam. I’ll try to keep an eye for more posts falling into the spam filter in other threads.

    I’ve had posts with a single link get redirected to Davey Jones’s bit bucket. I don’t know why.

    I just want people to have access to high quality, inexpensive, Chinese handbags :/

    #74646
    bill.onthebeach
    Participant

    ^Pup… dat Spam filter does NOT like TOO MANY CAPITAL LETTERS either…

    #NCSU-North Carolina's #1 FOOTBALL school!
    #74647
    Rick
    Keymaster

    Packfanistan,
    Before the gentler kinder Rick, you would have thought it was me 🙂

    #74648
    Rick
    Keymaster

    ^Pup… dat Spam filter does NOT like TOO MANY CAPITAL LETTERS either…

    Not too many uses of the word ‘Gott’

    #74649
    Tau837
    Participant

    Though I don’t entirely agree with the methodology he uses, this is a nice little article showing that at least a couple other systems outperform the RPI in predicting NCAA Tournament results

    As has already been pointed out, the RPI isn’t designed to predict anything. So not sure it matters if other systems are better at that.

    #74650
    choppack1
    Participant

    Here is an interesting quote in the linked article.
    The RPI rather tends to underrate teams from strong conferences and regions and to overrate teams from weak conferences and regions

    And this is why its smart to schedule good teams in bad conferences… I also would be sure to play a UNCG and its various equivalents around the country on the road every year.

    #74651
    xphoenix87
    Moderator

    Thanks wuf, I was wondering why that wasn’t posting.

    Where your argument still uses numbers to compare and justify, I merely took numbers completely away from the decision process. The ‘eye test’ is subjective, but you still have actual on-court results to rely on. To me, it was a weak schedule with few things truly standing out that screamed ‘select me!’ – even if one feels the team passed any ‘eye test. I’m considering the entire body of work.

    But you’re still using numbers. You’re using win-loss records. I doubt you watched most of the games SMU played in their OOC schedule. I doubt you saw any games those teams played. You’re going by their W/L record, what you know about their conference, and the fact that their RPI is bad. But again, I’m not arguing that their OOC schedule was good. I’m arguing that they blew away most of it (which is what good teams do) and had a bunch of good games in conference, and their overall schedule wasn’t nearly as bad as RPI suggested it was.

    The RPI formula has been adjusted several times over the years, so “arbitrary” isn’t really accurate. You’ve mentioned several other formulas that you claim are better. While it’s obvious that they’re different, it’s not obvious that they are in fact better.

    It’s arbitrary because there’s no reasoning, either mathematical or practical, for the weights that things have been given, and there never has been, as I pointed out in my post above.

    I don’t want a “formula” that claims to be predictive. The job of the Selection Committee is to evaluate what has already happened, not predict the future.

    This is a line that the NCAA has often brought up, but it’s a complete straw man. What we’re trying to find is the best teams. The way you determine who is the best team is to see if they beat other teams. Putting aside matchup considerations (which none of these systems bother with anyway), saying “team X has played better than team Y” and “team X is likely to beat team Y” are exactly the same thing, only one is phrased descriptively and one is phrased predictively. If your system does a good job at figuring out how good teams are, then it will have predictive value.

    Using margin of victory is a double-edged sword as discovered during the BCS era. Plus there are many games where the final margin is not indicative of how close the game was for 39 minutes…then the fouling and missed 3-pt shots skew the final margin.

    Margin of victory is a better indicator of team quality than W/L record. This has been shown over and over again in studies from various sports and various skill levels. Over a large enough sample size, if we were to predict the results of college basketball games and you used only W/L record and I used only MoV, not only would I beat you, but it wouldn’t be particularly close. Are there individual games where MoV doesn’t indicate how close the game was? Sure, but I don’t actually care about individual games, I care about games in the aggregate. And even if that is true, it’s not an argument of not using MoV, it’s just an argument that MoV doesn’t tell you everything (which no one would ever assert). MoV still gives you way more information than W/L record. Also, if you’re really afraid of people running up the score (which is a seriously insignificant problem), you can add something to your formula which gives diminishing results for blowouts (as BPI does).

    #74652
    xphoenix87
    Moderator

    RPI is ONE component that the committee considers.

    This is true, but as people have consistently demonstrated, and as this very post is a perfect example of, you can pretty reliably project the NCAA field using only RPI data, which points to it being not just a piece, but a big piece of what the selection committee is doing.

    I’ll quote a passage from this terrific article by Nate Silver from back when the NCAA held a mock selection committee back in 2012:

    Over the long run, R.P.I. has predicted the outcome of N.C.A.A. games more poorly than almost any other system. And it shows some especially implausible results this season. Southern Mississippi, for instance, was somehow ranked ahead of Missouri, even though it has endured seven losses to Missouri’s four (some of them against middling teams like Houston, Texas-El Paso, Alabama-Birmingham and Denver).

    The committee’s use of R.P.I. is not quite as obsessive as you might think: more advanced systems like those developed by Ken Pomeroy and Jeff Sagarin were just a mouse click away, they told us — and it was perfectly well within the rules to look at them. The discussion of each team, moreover, was exceptionally thorough. It was clear from the officials we met that the committee has plenty of basketball knowledge and cares passionately about getting things right.

    But R.P.I.’s fingerprints were all over the process. When a computer monitor displayed the teams that we were considering for the bubble, the R.P.I. ranking was listed suggestively alongside them. The color-coded “nitty gritty” worksheets that the committee has developed, and which often frame the discussion about the bubble teams, use the R.P.I. rankings to sort out the good wins and the bad losses.

Viewing 25 posts - 26 through 50 (of 96 total)
  • You must be logged in to reply to this topic.