Happy New Year to Wolfpack Nation! It’s the first day of the New Year and a perfect time to summarize what has happened in the basketball preseason as we head into conference play.
.
All of our long-time readers know that here at SFN we love to discuss and analyze the phenomenon known as the NCAAT Bubble….who’s in, who’s out, and who’s hanging on with hope and a thin thread? The criteria that I use are explained and justified here.
.
The main limitation of my approach is that there is no way to actually develop criteria that could be used without modification for each year. The field size is set and the accomplishments of a given team one year don’t necessarily guarantee a selection in another year. However as shown in the entry linked above, the criteria for schools in the major conferences are reasonably consistent from one year to the next. Each year, there will always be discussions, decisions, and controversy over the last few slots because any team not easily placed in the field will have a few bright spots along with a few embarrassing losses.
.
So the way that I prefer to direct this discussion is to watch the results during the conference season and see who plays their way in or out of serious discussions. Then if life doesn’t get in the way, we will have one last big discussion going into the ACC Tournament to see which of our bubble teams need some big, impressive wins to have any chance of receiving one of the last few at-large selections (or even the very last selection like State got last year).
.
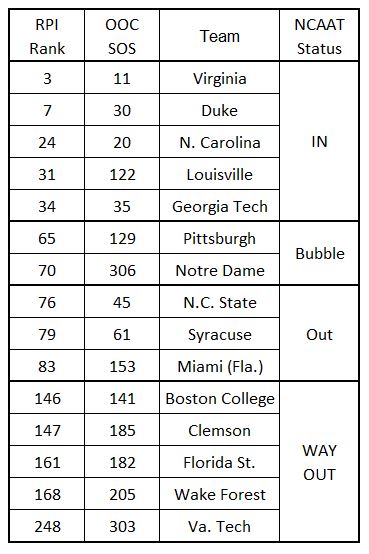
So for our opening discussion, here is a table summarizing where everyone sits with RPI, SOS, and NCAAT Status (data transcribed from CBS Sports):
Holding off on State for a little, here are some things that stood out to me:
.
– Every year I see comments that illustrate that the RPI calculation and ranking system are not well understood by many. The first part of this entry is my attempt to provide a simple explanation and context for understanding the RPI. (Sorry for the formatting issues that have developed after numerous server and software changes over the years.)
– If needed, I can do a new entry on the RPI where we discuss the various parts that typically confuse people. The big thing to remember is that at the first of the season, each game could produce HUGE changes in a team’s RPI ranking. Mathematically this makes sense because each game represents a relatively large percentage of the total games played. As the season wears on, each successive game will represent a smaller percentage and the big swings will even out. For now, just ride the wave and see where it takes us.
– As things sit today, I’m probably the only person making any attempt to project a tournament field that lists ND as being “on the bubble”, especially since they’re ranked 13/14 in the voting polls. I could write a whole entry on ND, their RPI ranking, their AP/Coaches ranking, and their miserable OOC schedule. But for now, let’s just quickly put their 13-1 (1-0) record into its proper context:
- 11 of their 14 games were played against teams ranked 100+ by RPI and six of those are ranked 201+. (But at least they beat their cupcakes.)
- ND is 2-1 against teams ranked in the top 100, with their loss coming to #19 Providence and their wins coming against UMass (#51) and Mich St (#64).
- I could have easily listed them as “out” since no team from a major conference has received an at-large bid with an RPI that high. But their RPI ranking will be “depressed” throughout the season and into Selection Sunday, so I took pity on them today.
– For anyone that thinks that I’m being too hard on ND (I’m not) just because I always pull against them in any sport unless they are playing UNC (which I do), let’s take a little look back at what happened to Penn St in 2009:
- 2-4 against the RPI Top 25
- 4-5 against #26-50
- 22-11 overall and 10-8 in conference
- 1-1 in B-10 tournament
Oh by the way, Penn St didn’t make the cut and dropped to the NIT.
PS – A piss-poor OOC schedule (#304 for Penn St in 2009) can easily come back to haunt you. Seth Greenburg proved this several times during his tenure at VT and it even bit Herb once at ASU.
.
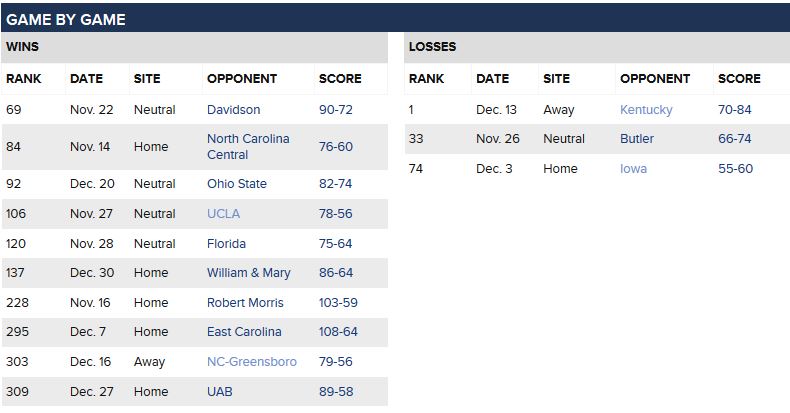
– It’s really not that difficult to put together a schedule that ranks reasonably high. For instance, here is UNC’s 20th ranked schedule:
Is that schedule really that tough?
.
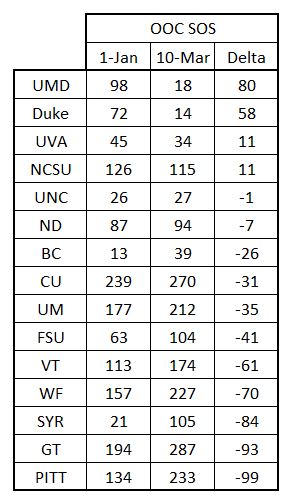
– Ok, I’m done beating this particular drum…at least for now. But remember that the OOC SOS will continue to change over the course of the season. For example, here are the changes that occurred last year in OOC SOS between Jan 1 and the end of the season:
There are no real conclusions or projections to make from this (new to me) information. It’s just something we’ll need to be sure and include in our last bubble watch before the ACCT.
.
– I haven’t seen GT play yet, so I was really surprised to see how high they were ranked and they have a Top-25 win against UGA (That makes UGA 0-2 against GT this year.) If they are really that good, then that would be a HUGE turnaround for the Jackets.
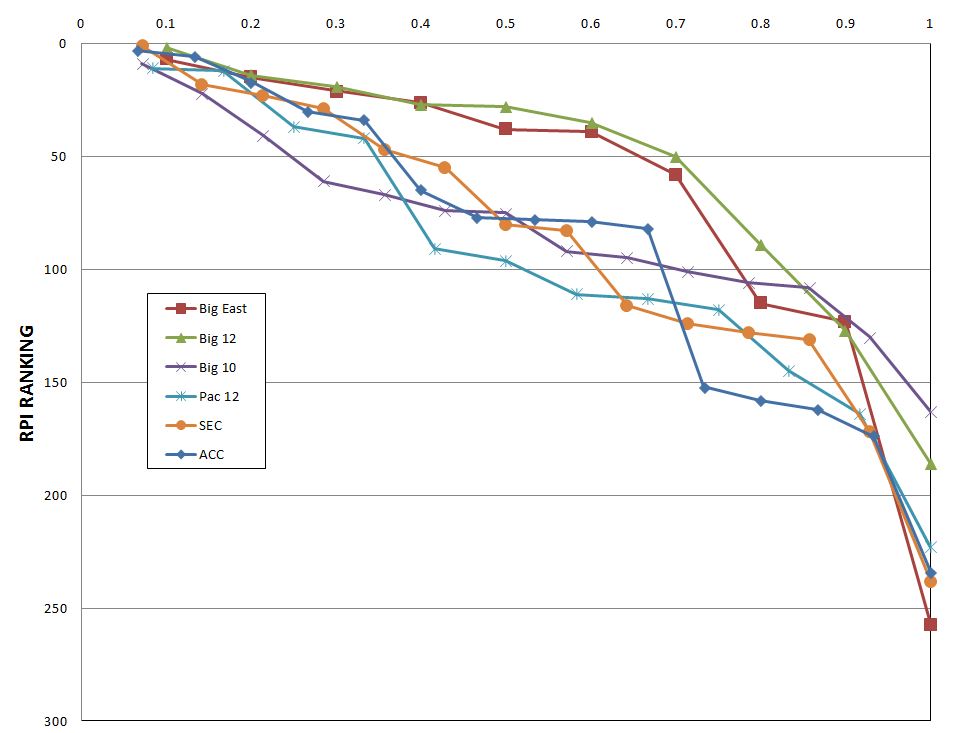
– This time last year, the worst RPI ranking in the ACC was BC at #152. The ACC wasn’t very good last year and is obviously much worse this year. Here’s a comparison graph of the top conferences in college basketball:
This graph fails my KISS principle for charts at work. In real life, this type of graph would hopelessly confuse both my management and the customer. But here are the key points that I get from this graph:
– The Big 12 and Big East are substantially ahead of the other conferences. You can churn the numbers any way that you would like, but the other conferences are pretty well clumped together.
– The Big 10 kicked the ACC around in the ACC/B-10 challenge this year. But the B-10 only has three teams in the RPI Top-50. So it will be interesting to see how many teams each conference puts into the NCAAT this year.
– The main reason that I put this chart together was to illustrate just how bad the bottom third of the ACC is. The bottom of the ACC is substantially worse than last year and substantially worse than the most of the other top conferences. Our look at ACC SOS could reveal some really divergent SOS’s this year.
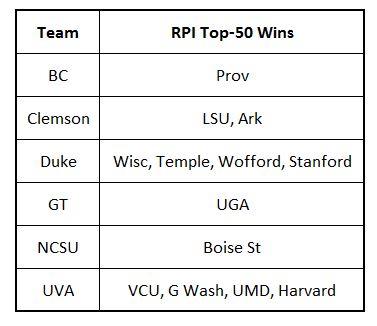
– Another way to highlight the weakness of the ACC this year is to summarize its Top 50 wins.
NCSU SPECIFIC STUFF
.
– Jeff forwarded an interesting link about the ACC OOC schedule last week. Here’s what it had to say about State:
Triangle neighbors Duke and N.C. State are in a tight race for the second-toughest non-conference schedule, with the Blue Devils earning the nod here due to the Wolfpack’s lack of a Top 25 opponent and their tendency to play so many home games. Mark Gottfried has always scheduled with the infamous RPI strength of schedule rating in mind, and who can blame him? The RPI rewards a win over a team ranked #150 much more than it does versus a team ranked #300, even though good teams should beat both squads relatively easily. Therefore, many of N.C. State’s opponents are chosen because they are expected to fall in that upper middle tier of the RPI: nine of N.C. State’s 13 non-ACC opponents currently have KenPom ratings between #59 and #114.
– I seriously doubt that Gottfried gave a quote to this writer, so I don’t know how he came to his conclusions. Not that I disagree with them, but conclusions and suppositions shouldn’t be presented as facts.
– During the days of the Great Herb Debate, I always made the argument that a consistent OOC SOS showed that the coach was getting exactly what he wanted. Season ticket holders might still be disappointed on the teams coming to Raleigh…but at least Gottfried doesn’t dig a hole with scheduling that the team has to climb out of.
– The comment on home scheduling is also on point. During the Herb era, a commenter to one of my entries tabulated several years of OOC games and found that State generally played at least 10 OOC games in Raleigh. The trend continues today and my guess is that State wants this number of home games for revenue purposes (both for increased revenue but also for reduced expenses.)
– State is in virtually the exact same position as last year. Several disappointing losses, one win that might turn into something significant, an RPI of 70+, and a lot of work to do if State wants to make it four straight NCAAT appearances.
– The team seems to have a number of good players, but they have not jelled into a good team. Whether or not they do form a cohesive team will likely determine their post-season destination…which will be somewhere between the NCAAT and their couches.
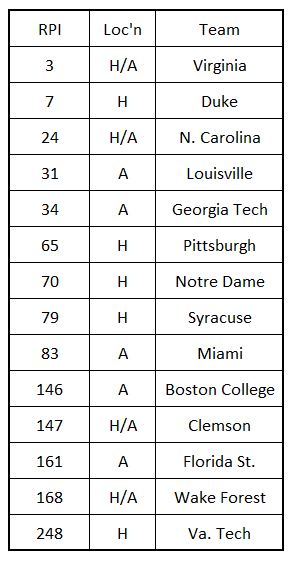
– Here is State’s schedule summarized with current RPI rankings and game locations:
At worst, this schedule will rank somewhere in the middle of the conference in terms of difficulty. How you compare a “dumbbell” distribution (2 good and 2 bad) with one concentrated around the middle of the conference is up for debate. But the advantage of a schedule like State’s is that it gives the team more chances to get the big wins that are needed to make the NCAAT.
State plays seven games against the teams currently in the top third of the conference, with three at home. Three of the four games against the other teams in the middle of the conference are in Raleigh (in case one of these moves into the top third). Along with big wins, State needs conference wins as well. You don’t want to go into Selection Sunday with a losing conference record…especially since State should have 5-7 wins against the dregs of the conference if they stand any chance at an at-large bid.
Looking at the schedule chronologically, the second half of the schedule is mostly on the road. (PS, I really appreciate having the schedule on the right side of the front page at SFN.) Here’s how the second half breaks down:
– 3 of the last 4 on the road
– 4 of the last 6 on the road
– 6 of the last 9 on the road.
If the first half of the ACC season doesn’t go well, I shudder to think what will happen once State hits all of those road games.



You must be logged in to post a comment.