NC State Football By The Numbers – Post ‘Cuse Edition

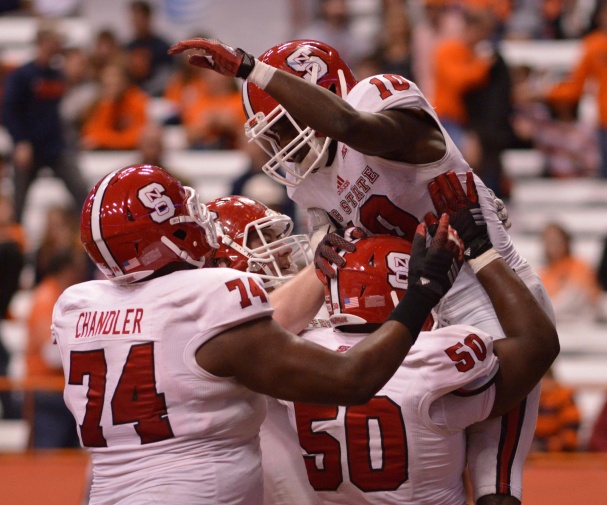
Here are the stats and national rankings after the Syracuse win at the Carrier Dome and the bye week.

Before the stats, the latest on the National and ACC championship belts.
WWE World Heavyweight-Championship-Title-Belt

National Heavyweight Championship: After beating Baylor and a successful title defense in Stillwater vs Oklahoma St, unfortunately my West Virginia Mountaineers dropped the title belt to TCU on a last second field goal. TCU next takes on Kansas St this Saturday for the title belt.

ACC Heavyweight Championship: FSU beat Louisville in a Thursday night game to retain the ACC belt. Up next for the Noles is the UVA Cavaliers on Saturday.

Team Stats – ACC & National Rank in Parentheses

Offense
Scoring Offense: 28.7 (9, 70)
Total Offense: 395.2 (10, 70)
Rushing Offense: 174.1 (6, 55)
Passing Offense: 221.1 (8, 75)

Passing Efficiency: 134.47 (7, 52)
Interceptions Thrown: 4 (2, 15)
3rd Down Pct: 43.4% (5, 39)
4th Down Pct: 44.4% (11, 78)
Red Zone Offense: 85.3% (7, 47)
First Downs Offense: 193 (4, 43)
Sacks Allowed: 2.33 (12, 86)
Tackles For Loss Allowed: 4.00 (3, 8)
Turnovers Lost: 11 (5, 29)

Defense
Scoring Defense: 27.6 (13, 75)
Total Defense: 389.1 (11, 63)
Rushing Defense: 171.1 (11, 73)
Passing Defense: 218.0 (8, 50)

Passing Efficiency Defense: 130.33 (11, 76)
Interceptions: 7 (9, 68)
3rd Down Pct Defense: 50.4% (14, 121)
4th Down Pct Defense: 50.0% (8, 57)
Red Zone Defense: 77.4% (6, 32)
First Downs Defense: 188 (11, 79)
Sacks: 2.56 (7, 42)
Tackles For Loss: 6.9 (6, 31)
Turnovers Gained: 14 (8, 54)

Other
Turnover Margin: 0.33 (5, 40)
Punting: 40.36 (3, 16)
Fewest Penalties Per Game: 4.78 (3, 19)
Fewest Penalty Yards Per Game: 42.33 (4, 22)
Time Of Possession: 28:43 (10, 89)
Kickoff Returns: 18.57 (12, 113)
Kickoff Return Defense: 17.72 (2, 16)
Punt Returns: 4.20 (13, 110)
Punt Return Defense: 10.47 (12, 97)

Attendance
Total: 270,779 (4, 33)
Average: 54,156 (5, 37)
Pct Capacity: 94.05% (3, 39)

Schedule Strength
Past Opposition: 30-24 .556 (7, 36)
Future Opposition: 10-13 .435 (11, 87)
Cumulative Opposition: 40-37 .519 (11, 59)

Individual Stat Leaders

Rushing
Shadrach Thornton: 93 att, 498 yds, 5.4 avg, 7 TD
Matt Dayes: 68 att, 374 yds, 5.5 avg, 3 TD
Tony Creecy: 40 att, 234 yds, 5.9 avg, 1 TD
Jacoby Brissett: 81 att, 206 yds, 2.5 avg, 1 TD
Jaylen Samuels: 7 att, 95 yds, 13.6 avg, 1 TD

Passing
Jacoby Brissett: 171-279, 1982 yds, 17 TD, 3 Int, 61.3% comp pct, 138.92 rating
Garrett Leatham: 1-6, 8 yds, 0 TD, 1 Int, 16.7% comp pct, -5.47 rating

Receiving
Bo Hines: 34 rec, 443 yds, 13.0 avg, 1 TD
David J. Grinnage: 20 rec, 282 yds, 14.1 avg, 3 TD
Bra’Lon Cherry: 21 rec, 261 yds, 12.4 avg, 3 TD
Matt Dayes: 27 rec, 256 yds, 9.5 avg, 4 TD
Marquez Valdes-Scantling: 20 rec, 224 yds, 11.2 avg, 1 TD

Punt Returns
Bra’Lon Cherry: 6 ret, 35 yds, 5.8 avg
Bo Hines: 7 ret, 4 yds, 0.6 avg

Kickoff Returns
Matt Dayes: 19 ret, 370 yds, 19.5 avg

Field Goals
Niklas Sade: 9-13 (.692), long of 43

Extra Points
Niklas Sade: 29-30 (.966)

Punting
Wil Baumann: 42 punts, 46.5 avg, long of 67

Kickoffs
Niklas Sade: 50 KO, 63.6 avg, 28 touchbacks

Fumbles
Jacoby Brissett: 7 fumbles, 5 lost
Shadrach Thornton: 3 fumbles, 1 lost
Matt Dayes: 1 fumble, 0 lost
Bra’Lon Cherry: 1 fumble, 0 lost
David J. Grinnage: 1 fumble, 0 lost
TEAM: 2 fumbles, 1 lost

Tackles
Jerod Fernandez: 61
Hakim Jones: 60
Rodman Noel: 53
Dravious Wright: 44
Josh Jones: 42

Tackles For Loss
Rodman Noel: 7.5
Mike Rose: 7.5
Art Norman: 5.5
T.Y. McGill: 5
Thomas Teal: 5
Dravious Wright: 5
B.J. Hill: 5

Sacks
Art Norman: 4.5
Mike Rose: 3
Brandon Pittman: 3
Thomas Teal: 2
Monty Nelson: 2

Interceptions
Jerod Fernandez: 2
Josh Jones: 2
Rodman Noel: 1
Jack Tocho: 1
Pharah McKever: 1

Forced Fumbles
Thomas Teal: 2

Fumbles Recovered
Monty Nelson: 2

About WV Wolf

Graduated from NCSU in 1996 with a degree in statistics. Born and inbred in West "By God" Virginia and now live in Raleigh where I spend my time watching the Wolfpack, the Mountaineers and the Carolina Hurricanes as well as making bar graphs for SFN. I'm @wvncsu on the Twitter machine.

'14 Football Rankings & Lists Stat of the Day

Home Forums NC State Football By The Numbers – Post ‘Cuse Edition

Viewing 25 posts - 1 through 25 (of 32 total)
  • Author
    Posts
  • #60766
    WV Wolf
    Keymaster

    Here are the stats and national rankings after the Syracuse win at the Carrier Dome and the bye week. Before the stats, the latest on the National and
    [See the full post at: NC State Football By The Numbers – Post ‘Cuse Edition]

    #60767
    pakfanistan
    Participant

    Jaylen Samuels: 7 att, 95 yds, 13.6 avg, 1 TD

    I’m just going to go out on a limb here and say Samuels needs the ball more.

    #60773
    ncsu1987
    Participant

    ^Yes, please.

    Based on stats, team strengths appear to be discipline (penalties, turnovers) and special teams. 3rd down conversion on offense continues to outperform the rest of the offense. Red zone defense continues to outperform the rest of the defense.

    #60774
    ruffles31
    Keymaster

    Quick question. How is our team punting this:

    Punting: 40.36 (3, 16)

    and Will Baumann have these stats:

    Wil Baumann: 42 punts, 46.5 avg, long of 67

    I don’t remember anyone else punting.

    #60777
    WV Wolf
    Keymaster

    The 40.36 is net punting

    #60779
    VaWolf82
    Keymaster

    Kickoff Return Defense: 17.72 (2, 16)
    Punt Return Defense: 10.47 (12, 97)

    Seems strange

    #60786
    modobrew
    Participant

    Fewest Penalty Yards Per Game: 42.33 (4, 2)

    This seems strange to me. How can we be 4th in ACC when there’s only one better nationally? Is that a mistype? Should it have been 4, 12?

    WV Wolf – I fixed the typo, thanks

    #60792
    Greywolf
    Participant

    Iโ€™m just going to go out on a limb here and say Samuels needs the ball more.

    He IS a load when he has the ball! I suspect that the only way Samuels could get many more touches would be to move him to RB and give him Creecy’s. Part of his success can be attributed to the infrequency with which we use him. DC’s are charting our tendencies and aren’t ready for Samuels. That fake punt is good for about once a year. ๐Ÿ˜‰

    #60793
    Greywolf
    Participant

    I do wish we could chart something like a “moving” average. Maybe what have we done in our last 4 games. Highs and lows would eventually move off the chart.

    This is a team filled with FR, RSFR, So’s and RSSo. Players are playing now that weren’t on the field the first of the season. Our base defense in now in and we are stunting off it. Just as our Offense is not the offense that built good stats that don’t reflect how we are playing now, our defense is not the defense that abused by GSU, ODU and others.

    Not complaining about the work that WV Wolf does. To the contrary I appreciate what he does. I just wish there was a way to get a picture of where we are now with what we have.

    #60794
    ncsu1987
    Participant

    ^Any particular stats you have in mind for trending? I can put this together (and I have a little time), just will take longer if the answer is “everything”.

    #60804
    Greywolf
    Participant

    “Any particular stats you have in mind for trending?”

    ncsu1987, Thanks for the offer. I’ve listed some stats that I have rearranged for comparative reasons. Some of these that would make sense to track trending might be useful.

    WV Wolf, if you are reading this, the groupings of Offense/Defense and the Sacks, TFL’s and TO’s +/- would IMO be useful in evaluating the stats.

    Scoring
    Offense: 28.7 (9, 70)
    Defense: 27.6 (13, 75)
    Total
    Offense: 395.2 (10, 70)
    Defense: 389.1 (11, 63)
    Rushing
    Offense: 174.1 (6, 55)
    Defense: 171.1 (11, 73)
    Passing
    Offense: 221.1 (8, 75)
    Defense: 218.0 (8, 50)

    3rd Down
    Offence: 43.4% (5, 39)
    Defense: 50.4% (14, 121)
    4th Down
    Offense: 44.4% (11, 78)
    Defense: 50.0% (8, 57)
    Red Zone
    Offense: 85.3% (7, 47)
    Defense: 77.4% (6, 32)

    Sacks vs. Sacks Allowed
    Tackles For Loss vs. TFL’s allowed
    Turnovers: Take-a-ways vs. Give-a-ways

    #60805
    tjfoose1
    Participant

    Iโ€™m just going to go out on a limb here and say Samuels needs the ball more.

    I agree, a little more at least, but his rushes are situational and thus, the avg ypr are somewhat inflated if you are trying to project results with more rushes. A diminishing returns thing.

    #60807
    ncsu1987
    Participant

    Here’s a first stab at something relatively easy to maintain:

    Is this useful? Note: this preserves the order in WV’s weekly posts.

    #60808
    ncsu1987
    Participant

    Sorry, should have mentioned, those are game by game national rankings.

    #60810
    Greywolf
    Participant

    Very good! I like what you have done!

    Just wondering, could you put in GT’s current ranking. That might be fun to see compared to our ranking.

    Before I make another request, how easy/difficult would it be to use conference rankings? [You can see where this is heading, can’t you?] ๐Ÿ˜‰

    Thanks for your work!!

    #60815
    choppack1
    Participant

    Our offense is clearly going down the crapper… The next 3,games should tell us if its just because we’ve played 4 pretty good d’s or if we are just bad offensively.

    #60818
    ncsu1987
    Participant

    Grey: using either national or conf rankings (or both) is equally easy. Adding GT’s current ranking would be very easy, but trying to reconstruct GT’s historical rankings would require additional research.

    Ask away (just to be sure I see where this is heading…)

    Oh, and BTW, just to be clear, after re-reading your original request, you actually asked for a moving average. What I’ve charted is the raw data. If there’s need for an actual moving average, I can do that, but it will have to post as a separate chart. The sparkline charts are so small that in my experience if you try to overlay them, they quickly become unusable.

    Let me know.

    #60819
    VaWolf82
    Keymaster

    the groupings of Offense/Defense and the Sacks, TFLโ€™s and TOโ€™s +/- would IMO be useful in evaluating the stats.

    Scoring
    Offense: 28.7 (9, 70)
    Defense: 27.6 (13, 75)

    I like having the top level stats (rushing, passing, total, scoring) all together for one unit. Any mismatch in these stats shows that deeper evaluation is required. For instance, an offense that has trouble in the red zone would have a higher ranking in total offense versus scoring offense. You could then check the redzone (and maybe third down stats) to confirm your initial thoughts.

    I don’t see the value in comparing State’s offense to State’s defense in any particular category. Note that I’m not arguing, I just don’t see how you intend to use these comparisons.

    #60820
    redisgood
    Participant

    I maintain the offense has gone south because our QB has lost confidence in the offensive line, and the offensive line has done everything they can to deserve it.

    #60821
    Greywolf
    Participant

    Note that Iโ€™m not arguing, I just donโ€™t see how you intend to use these comparisons.

    I’m an older guy as you likely know and remember the days when good and I mean really good football teams would or could go undefeated averaging say 20 points a game. These days a team averaging 20 ppg might have trouble winning a game. [see NCState] ๐Ÿ˜‰

    I was thinking how a team did relative to itself might be more important than how a team did relative to a national average. [see Duke and Pitt Sat.]After I rearranged the stats and looked at them I saw how I could quickly check how a team did relative itself very quickly and only the total scoring made any real difference.

    You could say that my even looking was a compliment to WV Wolf for producing the stats as I had never cared how we ranked nationally before. I still think how we rank in the conference would be more useful than how we rank nationally.

    The only stat I would argue for is the Take-a-ways vs. Give-a-ways as this stat seems one of the most important — kind of like the +/- in hockey.

    Speaking of hockey “How ’bout dem Canes!” Saw them Sunday and will see them Friday and of course watched Saturday and last night. If there ever was an argument for “team effort” IMNSHO the Canes are it. With everyone buying in, they are hard to beat. Without all out team effort, they can’t win a game.

    Maybe the Pack is that way.

    #60822
    Greywolf
    Participant

    after re-reading your original request, you actually asked for a moving average.

    After further consideration I wonder how much moving average in our football schedule would be useful. Too much difference in relative strength of our opponents. Moving averages of something like golf or work units produced would or could measure current skill level whereas averages would tend to hide significant improvement especially as the totals got higher. Moving averages in free-throw shooting would be a better indicator of current skill than averages.

    Also some of my answer to VaWolf82 above might be interesting to you regarding this same conversation.

    Thanks to both you and VaWolf82. This conversation is a whole lot more fun than some of the pissing contests I’ve gotten in. ๐Ÿ˜‰

    #60823
    VaWolf82
    Keymaster

    The only stat I would argue for is the Take-a-ways vs. Give-a-ways as this stat seems one of the most important โ€” kind of like the +/- in hockey.

    Or you could use “Turnover Margin” which is already calculated and listed.

    But I’m glad that you brought this up. Occasionally you can find teams where the scoring offense is ranked much higher than the total offense. TO Margin is the first place that I look to see where the points are coming from.

    Several years ago, UNC had an offense that was constantly being fed by opponent’s turnovers. But when they ran up against Russell Wilson, the turnovers weren’t there and State beat UNC handily.

    Conference versus national rankings is an interesting discussion. You could argue this one in circles for days. The biggest fallacy with either ranking is that the OOC games vary greatly in difficulty and thus can easily skew the predictive value of either ranking. Since State’s OOC schedule was so weak, it was easy to see that State’s ranking would be artificially inflated. Thus we cycle back to my “average” offense ranking being too generous.

    In the days of acceptable conference sizes (12 teams or less), you could go to websites that ranked the various stats based only on conference games. If proper adjustment was made for teams played, you could get a better idea of where State stood in the conference. But no more. So the difference between conference or national stats is not worth arguing about. But even if you care deeply about one over the other, WV lists both for us.

    #60830
    ryebread
    Participant

    ncsu1987: Great job. A larger view of this, with a larger trend line graph would be fantastic.

    Grey: I’m one of the ones who requested national numbers. My argument is this — are the conference stats skewed because the conference is collectively good or bad at something?

    For example, let’s say we have 3-4 NFL quality QBs in the league. That has happened in the past and will happen again. Maybe we have one as well, but he’s the 4th or 5th best QB in the league. He might still be in the top 15 or so nationally. Compared against the ACC QBs, that might not look good, but the national view helps us appreciate what we have.

    This also allows one to better understand the macro level offense and defensive stats. Let’s say that State is giving up 23 points per game and the conference average is 24 PPG given up. Those points per game are heavily skewed by facing ACC offenses. Are those offenses just all bad? Are we abnormally good at something like take aways that keeps points off the board? The national numbers give us something to compare too that isn’t as highly influenced by our control (ACC competition).

    This is also good to help one spot the mid-major effect. A strong mid-major might roll up in conference, but then when the out of conference games are factored in, the numbers dip considerably. Or, simply put, the numbers just aren’t that impressive outside of that team’s control.

    I look for outliers — things where our performance looks okay in conference but great nationally, or vice versa. Those are better indicators (to me) of things that we do well or are poor at.

    #60834
    Prowling Woofie
    Participant

    Attendance
    Total: 270,779 (4, 33)
    Average: 54,156 (5, 37)
    Pct Capacity: 94.05% (3, 39)

    Given the product on display on the field, I dare say we’ve heard the last grumblings from the coaching staff regarding fan support ????

    #60835
    pakfanistan
    Participant

    Given the product on display on the field, I dare say weโ€™ve heard the last grumblings from the coaching staff regarding fan support ????

    Good lord that one comment has been blown out of proportion.

Viewing 25 posts - 1 through 25 (of 32 total)
  • You must be logged in to reply to this topic.