Thanks to a sports injury I was laid up in bed with nothing to do for the better part of a week. During that time I had some time to watch basketball, both good and bad, and reflect on the state of the Wolfpack basketball program. Since the Pack’s 2014 Epic Fail in the round of 64 we’ve had transfers and early departures announced, discussions of Gottfried vs Archie Miller as the coaching carousel attraction has started spinning, and what does the future hold for NC State. All of this can be found on the main page or over on our forums. (Just click on the Forums button above in the header)
As we head into the Final Four (FF) weekend to determine the national champion I asked, Is NC State moving towards hanging another national champion banner? If the ultimate goal of the program is to win titles then shouldn’t we see what it takes? More specifically the goal the program should be striving for is reaching the Final Four because once you’re there it’s only 2 games in 3 days to become a national champion. Yes you have your occasional Cinderella’s crashing the party but most years all four teams are usually teams who aren’t sneaking up on anyone.
This will be Part I of a series of articles breaking down what a Final Four team looks like, is NC State realistically close to becoming a Final Four team, and what is Gottfried’s teams history to see if he can NC State to the promise land or unless there is a major change in philosophy does he have a ceiling.
I’m going to look at data from 2004-2014 (11 seasons) using Tempo Free Stats from KenPom.com. Why KenPom? I have a subscription so I might as well get my money out of it. Why did I pick this time frame? When I started I was looking at the last 10 years and we now have the current season Final Four Teams to add into it. I’m starting off Part I with a simple comparison of each Final Four team’s Offensive Rating (ORtg) and Defensive Rating (DRtg) to get a top of the mountain look at what a Final Four team looks like. I also included the average NCAA team rating and Mark Gottfried coached teams (Alabama and NC State) during the specified timeframe.
Note: For those not familiar with Tempo Free Stats, ORtg, and DRtg here is a breakdown of them from Ken Pomeroy.
“The purpose of this system is to show how strong a team would be if it played tonight, independent of injuries or emotional factors. Since nobody can see every team play all (or even most) of their games, this system is designed to give you a snapshot of a team’s current level of play.”
“I try to measure skills based on the opportunities for those skills to be observed. On the team level, this often means ratings the offense (and defense) on points scored (and allowed) per possession. Since we need to know things in terms of possessions and possessions is not an official NCAA statistic, it must be estimated.”
“Adjusted offensive efficiency – An estimate of the offensive efficiency (points scored per 100 possessions) a team would have against the average D-I defense.”
“Adjusted defensive efficiency – An estimate of the defensive efficiency (points allowed per 100 possessions) a team would have against the average D-I offense.”
1.21JW: Basically tempo free means removing the pace at which teams play out of the equation to get all things equal. You can’t compare PPG between teams as to how well they play because some teams like to slow the game down and have as few possessions as possible. That way they can try to be more efficient with each possession versus the opposing team, thus a low scoring affair where they try to force (or hope you’ll make) more mistakes than them and thus they will outscore you. On the flip side a team may want to speed up the game, get as many possessions as possible to negate not being as efficient with the ball. Which team is better? This is where looking at how effective they are with their possessions is able to compare apples to apples.
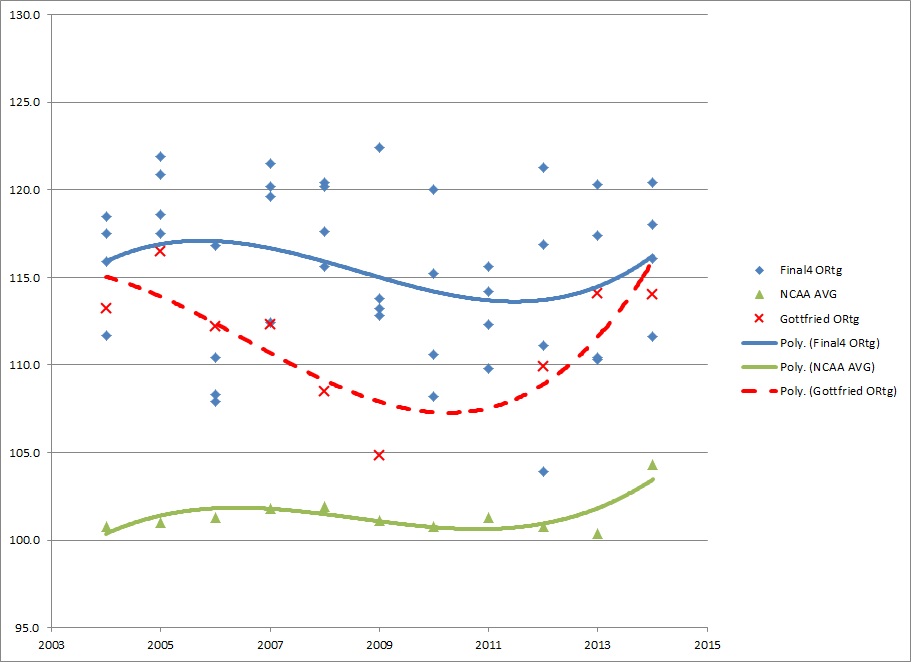
So moving on to the topic of comparing Final Four teams, Mark Gottfried coached teams, and the NCAA average. Here is a graph of just the Offensive Ratings since 2004.
NCAA Tournament Final Four Teams – Offensive Ratings (2004-2014)

What you see is there is some variation from year to year but the typical Final Four team will usually be between 110-120 ORtg (meaning if they had 100 possessions during the game they would score between 110 – 120 points), with the average team showing around 102 ORtg. We overlay Mark Gottfried’s Alabama and NC State teams during the time period and you can see, with the exception of his final 1.5 seasons at Bama, he usually has his team’s offense Final Four worthy. This doesn’t mean they don’t have flaws. What it means that his teams are just as efficient scoring on each possession as the Final Four teams are. If you can get your team to an ORtg of 115 then you’ve set yourself up just fine.
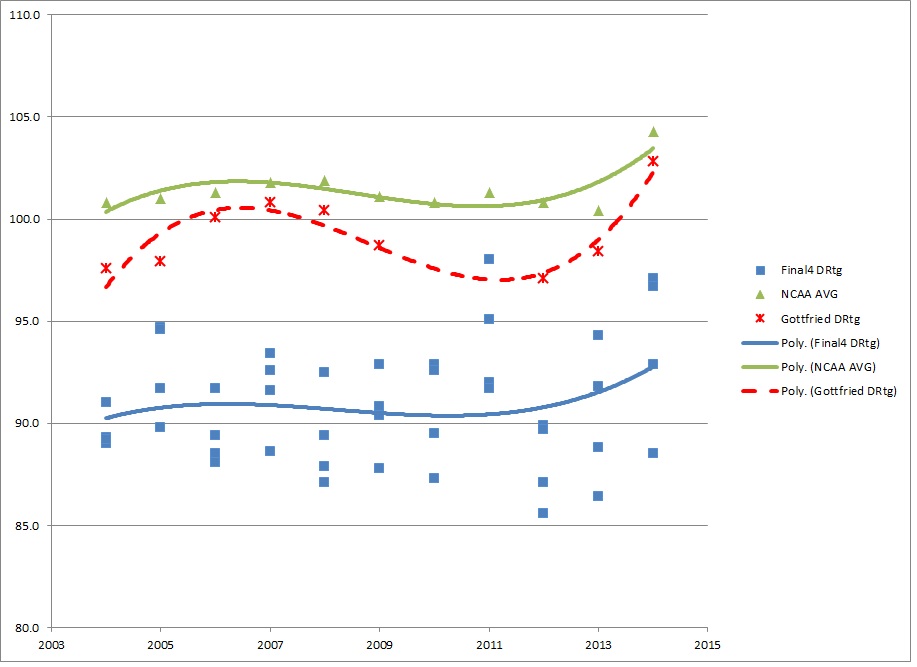
Now let’s move on to defense. We’ve all talked about the lack of defense we’ve seen from Gottfried’s teams while at State but how do they stack up against the FF teams? Is it just because he’s still building a foundation at State or is it because we’ve been really young at times?
NCAA Tournament Final Four Teams – Defensive Ratings (2004-2014)

As you can see in 2011 and 2014 the teams that reached the FF weren’t as efficient at stopping the opposition as the other years but where in 2011 the country moved towards the average on both ends of the court, 2014 the national collectively increased offensively. Why? I’m going to take a shot in the dark here and say the NCAA’s new rules on contact and the FT contest we saw so many times this year had a lot to do with the sudden change. Overall though you’ll see the FF teams are usually between 87-93 DRtg. So that’s the goal. If you want to have a chance at reaching the FF and winning the title then you better be shooting for a Defensive Rating in that range to go along with the FF Offensive Rating range. We overlay Gottfried’s teams and we see why his teams struggle. Why is it we don’t see many blowouts and thus getting the starters rest and more playing time to the developing players? Simple, if you’re philosophy is to simply out Offense the other team, then don’t expect to have many comfortable leads. This also shows why the 2014 version of the Pack struggled in so many games this year, they were simply not good defensively. Dare I say they were Average at best.
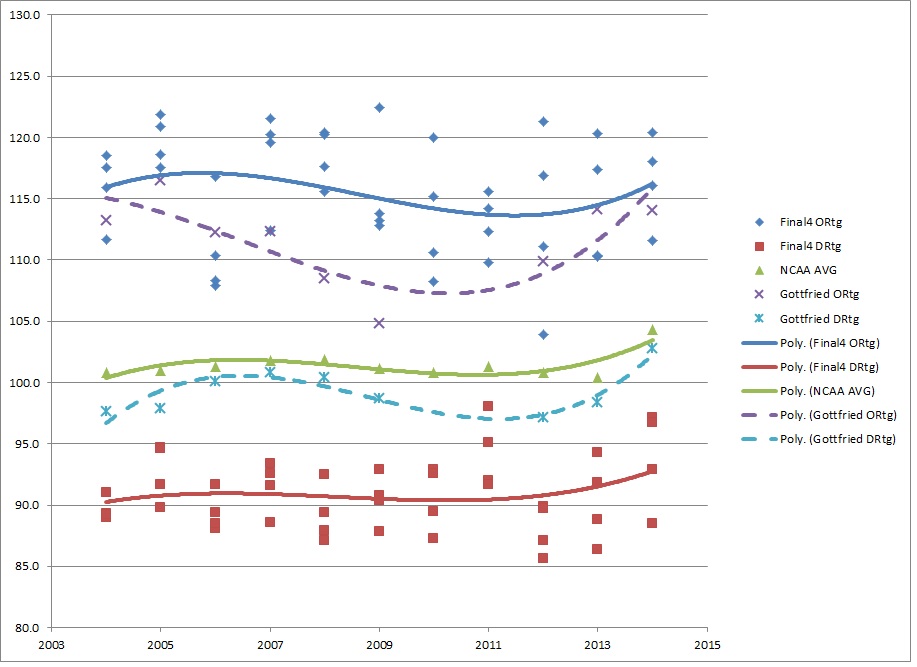
Now let’s combine the two graphs and get a better picture on both ends of the court and how Gottfried’s teams compare overall to FF teams.
NCAA Tournament Final Four Teams – ORtg & DRtg (2004-2014)

This is a clear cut goal of where you want to be if your goal is to reach the FF and cut down those nets. Being good at only one aspect of the game (In Gottfried’s case Offense) will never equate to obtaining your goal if you continue to ignore the other aspect. While Gottfried should be commended for doing such a great job with the offense, his defenses are historically slightly better than average and as such he will never reach the FF without either a major fluke in the tournament or a drastic overhaul of his defensive philosophy.
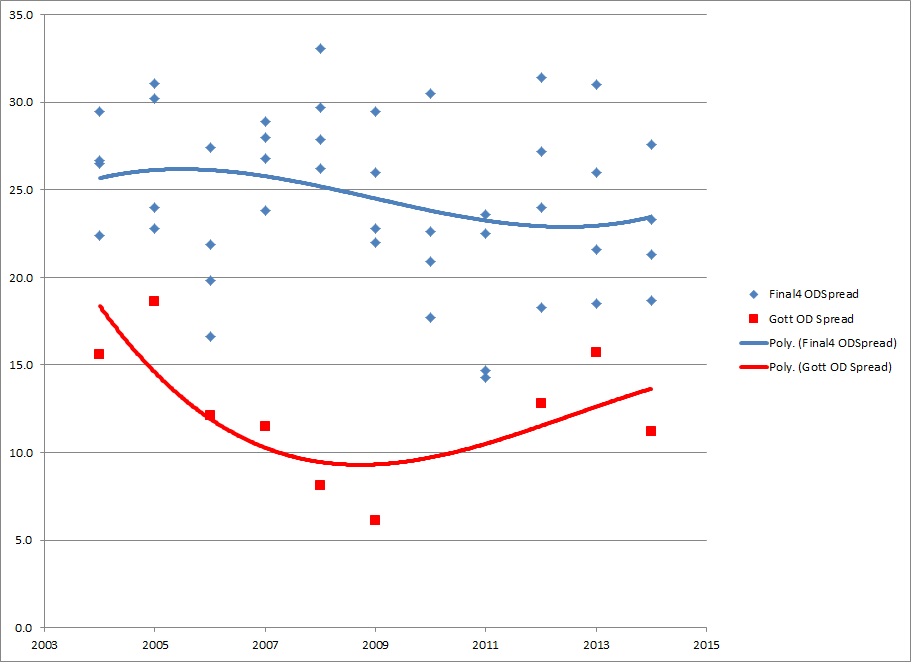
I wanted to add the following graph to the article after it was brought up in the comments section. This graph is a look at the Spread between ORtg and DRtg (ORtg – DRtg = ODSpread) with the Final Four teams and Gottfried’s teams. The previous graph shows you the band of ORtg and band of DRtg but what it doesn’t show is a team may have a great offense but a “bad” defense. What this graph shows is the difference between each teams O/D and gives a zone for that. As you can see below while Gottfried may be within 4-8 percentage points of the worst team in the FF he’s never been able to even get in the zone of what Final Four teams were during that particular season.

Gottfried’s 3 best ODSpread seasons at least have met the minimum of what teams had to reach the Final Four. So there’s that.
Next installment I’ll breakdown what goes into being a good defensive FF team and if there are any common denominators between them using the Four Factors.


