One of the entries that I’ve enjoyed most over the years is dissecting the talking heads and their inane “analyses” of teams that were wronged by the Selection Committee. But even Dickie V couldn’t find a mid-major to champion this year. Everyone was so upset over Louisville and Kentucky’s seeds that they apparently had no energy left for anything else. So since I don’t have anyone to make fun of, let’s get down to the analysis.
Assuming that CBS got the first four out correct, here are summaries of their resumes along with the last four teams in and The Dance Card’s lone miss.
As you would expect, everyone has some warts and we are going to have to pick through the garbage to find a few diamonds. Let’s start with a few teams that are easy for me to eliminate.
Team “I”
- Terrible RPI
- Losing conference record
- Poor performance in conference tournament
I guess that their Top-25 and Top-50 wins got them on the list, but those three negatives are virtually impossible to overcome. (Georgetown, welcome to the NIT.)
Team “C”
This team is like the question on a college exam that isn’t in the book, but was specifically covered in class. This is an easy problem to solve as long as you didn’t skip class that day.
OOC SOS ~300 + Poor conference tourney = NIT.
It’s not that their Top-25 wins are exactly ignored (though their AP ranking is ignored). This is strictly a punitive measure that we’ve seen levied against VT, Penn St, and Arizona St in recent years and now… SMU.
Team “G”
Good OOC SOS and dramatically weaker overall SOS means that this team came from one of the low major conferences. The 7-3 record over the last 10 games looks good, but this is simply a red herring. 1-1 against Top 25 and 0-1 against 26-50 means that they played virtually no one during the year and they also tanked in their own conference tournament. This is the prototypical mid or low major resume that lands in the NIT…and usually ends up on Vitale’s whine list. But I only saw one idiot (on CBS) that thought that Green Bay deserved consideration.
Quick Review
Eliminating three teams means that four of the six teams left were selected. Here’s an updated table:
So where do we go from here? Strangely enough, the two teams with the highest RPI ranking also have the most bad losses (ie against RPI 100+). So do bad losses really matter?
BAD LOSSES
The only bracketologist posted at SFN yesterday predicting a bid for State said something along the lines that they had fewer embarrassing losses than some of the other candidates. He was obviously (and surprisingly) right about State, but was he correct about bad losses? Specifically, does the presence or absence of bad losses mean anything significant?
I’ve always felt that the “bad loss” argument was over-blown though I’ve never taken the time to build an argument to support my feelings. But it occurred to me last night that I was ignoring a huge piece of statistical evidence against the bad-loss theory because The Dance Card doesn’t include anything in their calculations for bad losses. While not an absolute proof, the accuracy of the Dance Card’s predictions shows that bad losses don’t play a noticeable role in the selection process.
Further evidence against the bad loss theory is that teams A and B were both given at-large bids via the First Four. At worst, the bad losses moved Tenn and Xavier (A&B respectively) to the Tue/Wed games, but they are still in.
So that leaves us with four teams to evaluate. Two got in and two were left out:
So what stands out? Let’s pick out the best things that could be said about each team in this four-team group.
Team “D”
- Tied for most Top-25 wins
- Best RPI (probably insignificant)
- Least bad losses (if you still believe in that)
Team “E”
Best performance in conference tournament (their only Top-25 win)
Team “F”
- Tied for most Top-25 wins
- Most Top 50 wins
Team “G”
Second most Top-50 wins
I put a lot more value into RPI than a lot around here. So when I combine the worst RPI with a poor showing in the conference tournament, I would tend to drop Team “H” from the list.
But before I voted Team “H” off, I would want a closer look at all of the top wins since all four teams have six wins against the Top-100. I would be concerned that the categories (Top 25, Top 50, etc) might create a perceived advantage to one team over another. For example, if one team beat RPI #48 and another beat RPI #52, the parsing would make it look like the first team had a better win, when in fact the two wins are nearly equivalent.
I would like to get an honest, non-PC explanation on these four teams…but I’m not going to hold my breath. In any case, I think that any honest evaluation would conclude that the Selection Committee had an extremely tough job coming up with the last four in. So here is the last table repeated with the names of the last four teams that we are evaluating:
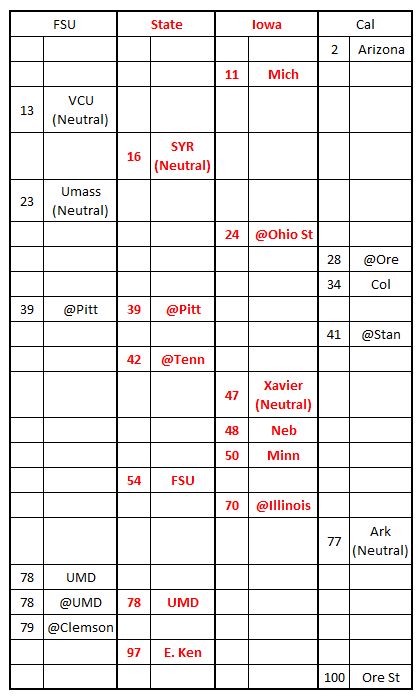
With Ron Wellman as chairman of the Selection Committee, it would be easy to claim that politics played a role in getting State into the NCAAT. However, with such slight differences between FSU and State, I don’t know of any reason for Wellman to favor one “State” over the other. As I mentioned earlier, let’s look at the Top 100 wins for these last four schools that we’ve been discussing.
The only thing that I see that favors State is that they did better in the conference tournament than any of the other three teams. That seems to contradict statements made by earlier Selection Committees that all wins were treated equal and even Wellman kept talking on CBS last night about looking at each team’s entire resume. So, I don’t know exactly what tipped the scales in State’s favor. But I’m certainly happy with the outcome.
3/18 ADDITIONS
My thanks to all of the useful comments and especially to the links as the various postmortems on the Selection Process are completed. These links and quotes are extremely useful to me and I frequently review past entries to see if there is anything that I should do differently as I prepare similar entries for the current season. While I almost never make major edits/additions once I get an entry up, there are several points to this year’s NCAAT selections that are important enough to document in the body of the main entry and not leave buried in the comments.
BYU and Bad Losses
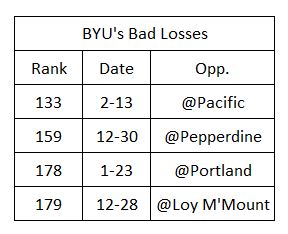
One of the teams often portrayed as not deserving a bid is BYU. The Selection Committee obviously disagreed and gave the Cougars a 10 seed. So while some bozos in the media obviously disagree, BYU was clearly not a tough decision for the Selection Committee. Here are a few tables to summarize BYU’s resume:
Looking at their W/L record broken down into various categories, anyone familiar with Herb’s NC State bubble teams would not be surprised that BYU got in and the seeding is quite familiar as well. BYU’s wins against Gonzaga (20), Texas (36), and Stanford (41) clearly meet the minimum standard that Herb so thoroughly explored in Raleigh.
If the Selection Committee is going to penalize a team for a weak schedule, then they obviously should reward a team for playing a tough schedule. While I frequently throw snide comments at Herb’s OOC scheduling, it is actually difficult to compare a mid-major resume to a team from one of the power conferences. BYU’s schedule (especially the OOC schedule) is clearly tougher than Herb has EVER played. But the conference schedule is weaker and it’s hard to tell exactly how all of those pieces fit together in the Selection Committee’s analysis.
But the key points are that BYU:
- Clearly got enough top wins to earn a selection
- Played a really tough OOC schedule and deserves some credit for that
BYU’s second table goes well with the earlier discussion of bad losses. The Cougars provide another data point illustrating that while bad-losses often lead to meltdowns among the fan base, they are not significant to the Selection Committee.
IOWA and Stumbling Down the Stretch
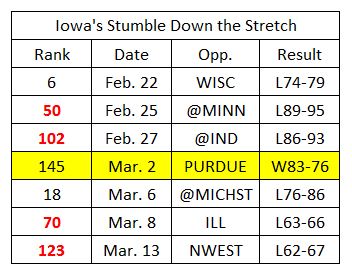
In the past, stumbling down the stretch is one of the qualitative measures that I used to identify bubble teams that were in trouble. However, the committee has recently stressed that they consider the whole body of work and don’t pay special attention to performance at the end of the season….which is a clear change from the past (especially with Herb’s NCSU teams). Iowa was one of the last-four IN and illustrates that the simple fact of stumbling down the stretch no longer leads to the NIT.
 The fact of whether or not a team stumbled down the stretch is not a key point. The point to pay close attention to is where did the stumble end.
NCSU vs SMU
Brett Friedlander had some good quotes from Ron Wellman (WF AD and Selection Committee Chairman) about the NC State selection that explain the Committee’s thought process:
“We tried to identify differentiators, things that are either very positive or negative about certain teams,” Wellman said “The positive factor for N.C. State was that they had three wins against top 50 teams away from home.
“Not only did they beat those top 50 teams (Tennessee, Pittsburgh and Syracuse), but they did it on the road. Road wins against top 50 teams are really, really impressive to the committee. That probably was the one factor that was most prominent.”
Another factor was nonconference strength of the schedule…According to Wellman, scheduling was the deciding factor between State as the last team in at 21-13 and SMU as the [first] team out at 23-9.
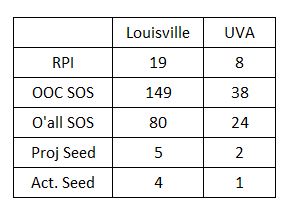
Louisville with a #4 Seed and UVA with a #1 seed
Once upon a time, I spent too much time creating a graph correlating RPI ranking with NCAAT seed to see how strong a correlation there was. I was surprised at the strong correlation and decided that I would update the graph every year. But some time later I was reading Jerry Palm’s old blog (collegerpi.com) and he said that 75% of the seeding decisions were within one seed of what you would calculate based solely on RPI. (There is nothing quite as depressing as discovering something that turns out to be old news). So while I didn’t bother with updating the graph, I have always used RPI as my starting (and frequently ending) point when it comes to seeding.
The one piece of “new” data that I discovered when doing the graph was that a top finish (first or second) in a power conference’s regular season standings would lead to a better seed than RPI would predict. Teams often get a slight bump as well for winning the conference tournament, but not always as much as winning the regular season (based on relatively few data points).
So let’s look at UVA and Lousville.
 The Selection Committee selects and seeds based only on this year’s resume. The fact that Louisville won the NCAAT last year never entered into this year’s decision-making process. I don’t know why it is so hard for people to figure out that the NCAA Selection Committee devised and have revised the RPI calculation to aid in selection and seeding of the NCAAT. They don’t care about Sagarin, Pomerory, AP Polls, or least of all ESPN’s BPI. They care about what teams have proven versus the their criteria.
It wouldn’t shock me if Louisville won a head-to-head matchup against UVA. But looking at this year’s resume, I would be shocked if Louisville had been awarded the two-seed that so many of the talking heads think that they deserve. Bottom line….Louisville got a small bump over what RPI would predict and their relatively weak schedule hurt them in both RPI and seeding. Other teams (including UVA) proved that they deserved their seeding by playing and beating other good teams. Louisville was 5-5 against the RPI Top-50 and that doesn’t impress me.


You must be logged in to post a comment.