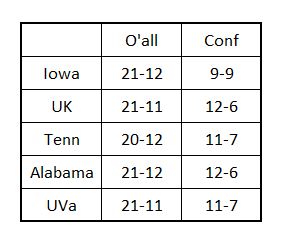
Some things are really hard to kill…like Count Dracula or the silly notion that 20 wins means something special to the NCAAT Selection Committee. No matter how many times I have shot down the 20-win nonsense, it comes back every year. I’m beginning to fill like a vampire hunter with a rubber stake.
In any event, I’m going to try one more time and follow some advice from a recent movie:
…Never shoot a large caliber man with a small caliber bullet.
Anything in life worth doing is worth overdoing…
Sole Survivor
Stake #1
Over the last several years, the NCAA has gone out of their way to hold workshops for various media types to explain the selection and seeding process. These meetings have even included mock selection exercises to illustrate the types of decisions that have to be made. Google around and read these articles like I have. If you find an article that talks about the importance of 20 wins, be sure and post it in the comments. (Pardon me if I don’t hold my breath.)
Stake #2
Using the information from statsheet.com, I counted 73 teams that won 23 or more games last year. You don’t have to be a math genius to see that all of those teams won’t fit in a 68 team field that also includes over 30 automatic qualifiers.
Stake #3
Maybe I missed the intent of the 20-win criteria. Maybe it is only supposed to work for the larger schools in the major conferences. Maybe it was also supposed to include teams that finished 0.500 or better in conference play.
Well if those extra qualifiers were supposed to be included along with 20 wins, then explain why the following teams found themselves playing in the NIT last year:
Note that this list is only from last year and isn’t necessarily all-inclusive.
Stake #4
A couple of self-professed basketball junkies and statistics PHDs have studied the selection process and attempted to reduce the selection process to a mathematical formula. They no longer list their selection criteria, but previous versions of the website did. Here are the criteria that were listed when I first wrote about The Dance Card.
– RPI (Ratings Percentage Index) Rank
– Conference RPI Rank
– Number of wins against teams ranked from 1-25 in RPI
– Difference in number of wins and losses in the conference
– Difference in number of wins and losses against teams ranked 26-50 in RPI
– Difference in number of wins and losses against teams ranked 51-100 in RPI
I wonder how a couple of statistics experts missed an obvious correlation between total wins and an at-large bid?
CONCLUSION
I like simple. I like accuracy. I hate being wrong. I like to support my conclusions with facts.
Every year when we have these bubble discussions, I find that most people share my first preference but not necessarily the others.
POST SCRIPT
Based on past experience, I expect that we haven’t seen the last of Wile E. Coyote or the 20-win nonsense.


You must be logged in to post a comment.