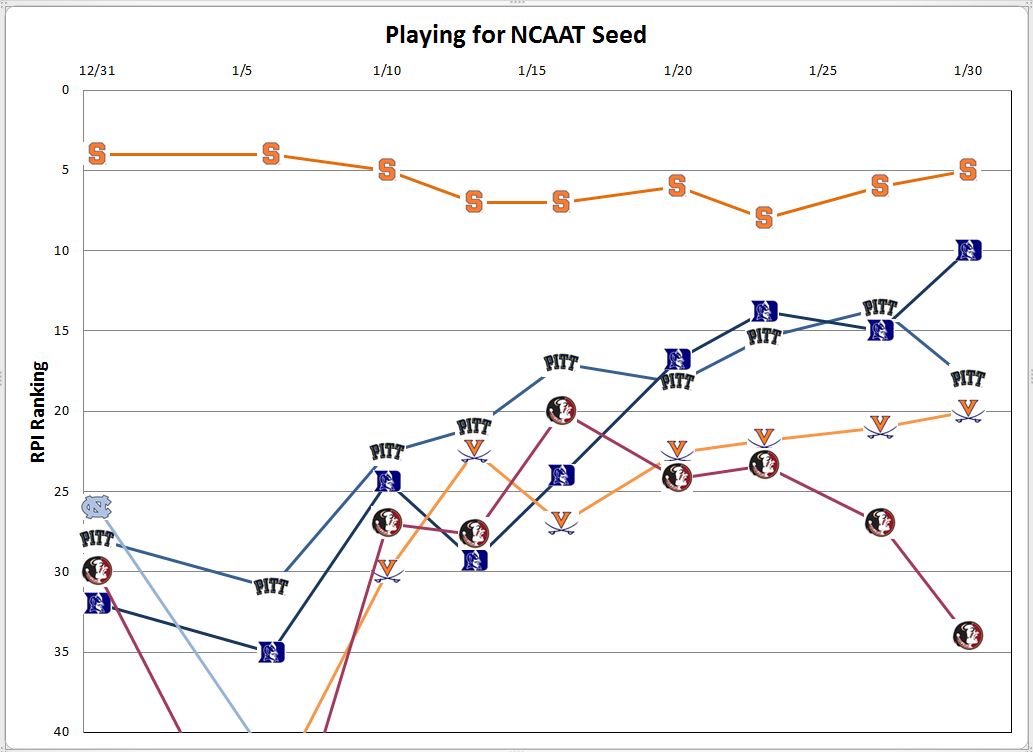
This update might get lost in the post-game threads, but let’s look at where the ACC stands after the first month of the conference schedule. We’ll start with the top 1/3 of the conference and the teams that are playing for seeding in the NCAAT tournament.
Nothing earth-shattering going on here, but FSU is beginning to turn the upward trend noted in the past into a peak. Since FSU is State’s best win, they should be every Pack fan’s second favorite team at least thru the end of the regular season.
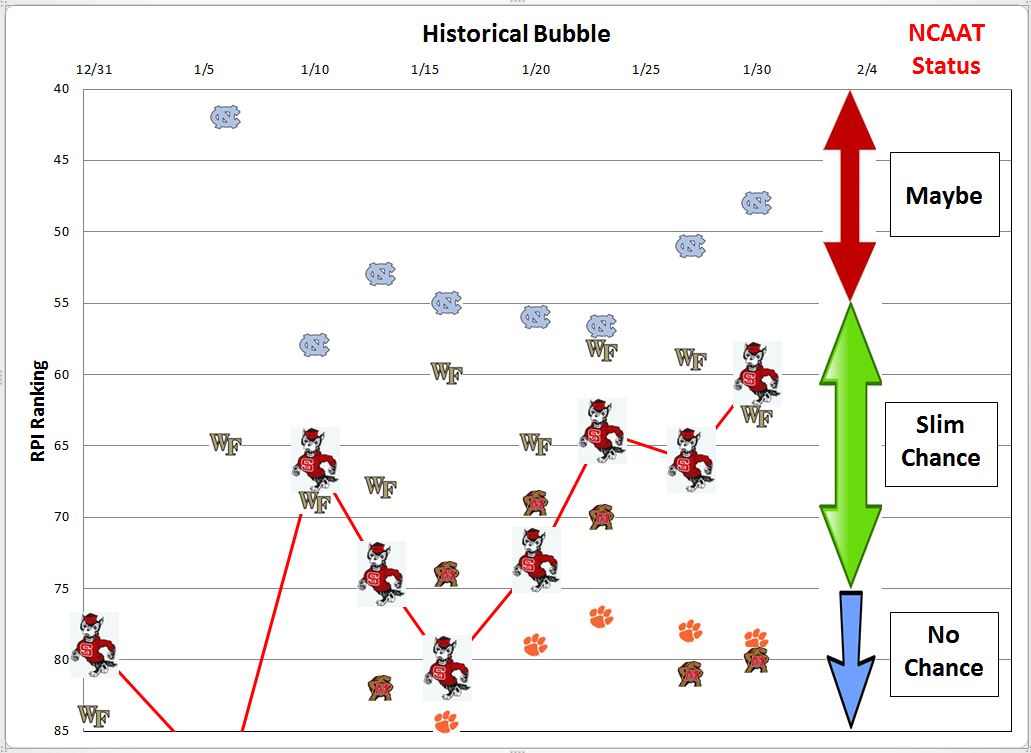
For the Bubble graph, I decided to remove some of the clutter and use Tuffy to highlight State’s season thus far.
Hopefully, last night won’t be the high point of the season…but it’s certainly the high point so far. It’s hard to know just how much effect last night’s win will have on State’s post-season chances. Baring a major road upset against Pitt or Syracuse, this will be State’s best win going into the ACCT. (But a win is always tons better than a loss.) Tenn might also be another Top 50 win as they keep dancing back and forth across that line (checking in at #49 this morning.)
CONFERENCE STRENGTH OF SCHEDULE
With the unbalanced conference schedule, there is often a great disparity between one team’s conference schedule and the next. For example, UMD has home/home games with Pitt, UVa, and FSU while BC has home/home games with ND, GT, and VT. (Just another fond farewell from the ACC to Maryland….ain’t karma a bitch?) As you might expect, UMD and BC represent the two ends of conference SOS variation this year.
In addition to the overall disparity in schedule difficulty from one team to the next, there can also be a variation between the two halves of a season for a single team. For instance, UVA only has one home/home series with the other teams in the top third of the conference….FSU. With the “new and improved” ACC scheduling, UVa and FSU have already played each other twice in a two-week period.
In past years, I’ve looked at the ACC SOS variations at the end of the season. When I started doing some preliminary work for another entry, I realized that there are some things that we should discuss now and see how they play through the second half of the ACC regular season.
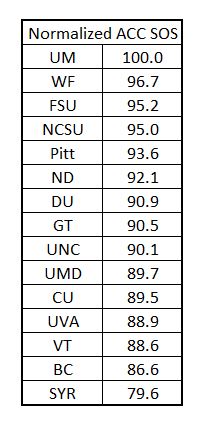
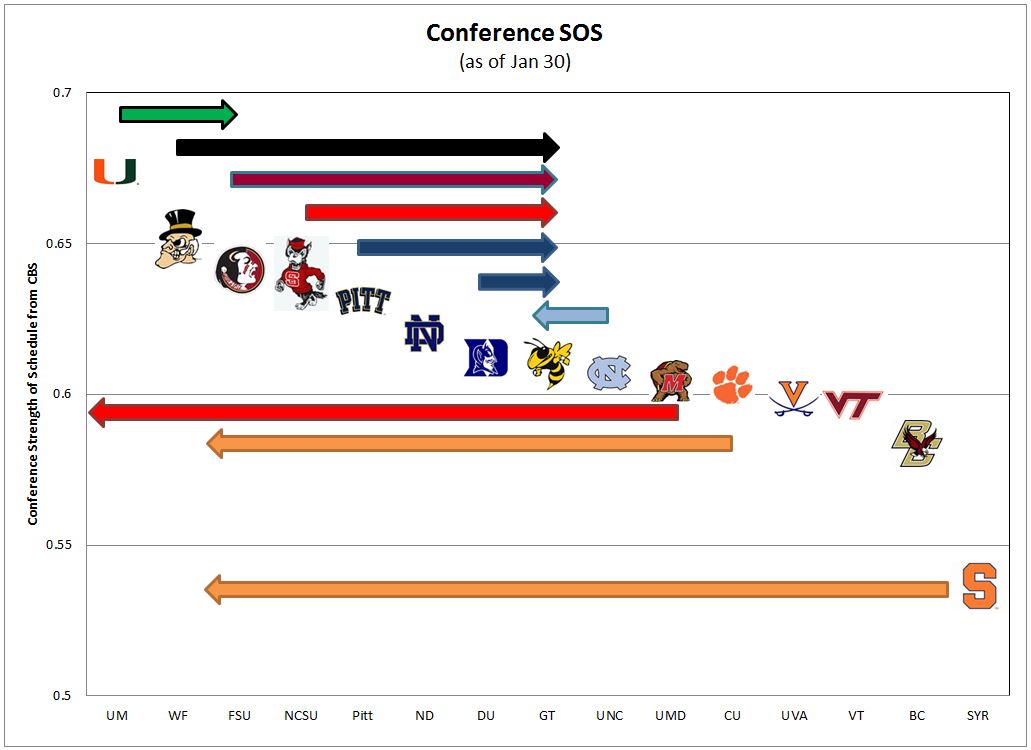
CBS Sports has a page for each Div 1 team that they call the RPI breakdown (ESPN has something similar). One of the interesting things that CBS calculates is a conference SOS. So a quick collation of the conference SOS lets us compare the schedules played to date. Here’s a normalized summary of the CBS data:
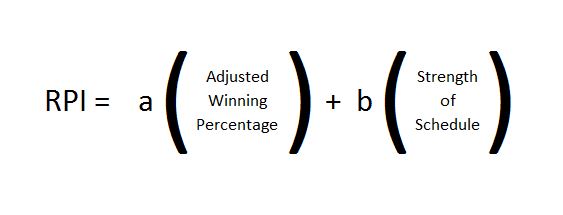
I was certainly surprised to see that not only was Syracuse at the bottom, but by a large margin. If you wondered about how an undefeated Syracuse goes up and down in the RPI Rankings, this conference SOS should help explain it. Here is a simplified RPI formula illustrating that the RPI calculation is simply a combination of your winning percentage and your strength of schedule (SOS is a combination of your opponents’ winning percentage and their opponents’ winning percentage.)
Basically the first-half of Syracuse’s ACC schedule is dragging down their overall SOS which allows teams with stronger schedules to move past them. But then as those teams ranked ahead of them lose, they slide back down past Syracuse in the rankings.
But for those who prefer graphics, I have the same information along with my projection of where the end-of-the year SOS ranking will end up. I suggest right-clicking the chart and opening in another window as I explain what I’ve tried to show with this graph.
As discussed above, UMD looks to have the toughest ACC schedule with 8 games (compared to a maximum of 9 games) against the top 1/3 of the conference. It is difficult for teams in the top 1/3 to match schedule difficulty of teams from the bottom of the conference, but Syracuse should end up with one of the tougher schedules in the conference. The Orange play home/home series with both Pitt and Duke and play FSU and UVA on the road. Of those toughest games, they have only played their home game against Pitt. The orange arrow is intended to show where I’ve projected Syracuse’s SOS ranking to end up after playing the harder games on their schedule. If Syracuse runs through their first ACC season undefeated, then that would say a lot about the ACC…and none of it good.
Miami and Clemson both have two home/home series against teams in the top 1/3 and that should put their SOS rankings close to Syracuse…which is what I’ve tried to show with arrows. If you combine the current RPI rankings of UMD, Miami, and Clemson with their projected schedule difficulty, I expect all three teams to drop out-of-sight low in our bubble graph.
The difference between Duke and Pitt’s schedule is very slight. They both play only one home/home series against the top 1/3…with both teams playing Syracuse twice. Duke had to travel to Pitt which gives them a tick mark towards a harder schedule. But Duke gets a home/home with GT and Pitt doesn’t double up on any of the bottom four teams….so a tick mark in Pitt’s column for harder schedule. My arrows show both teams moving towards the middle of the conference and I’m content to wait on CBS’s math to separate them.
UNC, NCSU, and WF have such similar schedules it’s almost frightening. All three teams have home/home series with the other two. All three teams have home/home with one team in the top 1/3…UNC and WF against Duke and State against Pitt (not much apparent difference there). If I’m right about there being little difference between Pitt/Duke, then the relative SOS ranking of these three teams will come down to how ND (for UNC), Miami (for State), and Clemson (for WF) match up against each other at the end of the season. FSU should end up somewhere close to these three, depending on how UVA compares to Duke and Pitt at the end of the year. All of these teams have arrows pointed towards the middle of the conference and we’ll wait on CBS to separate them.
UVA looks to have the easiest schedule of those teams in the top 1/3 of the conference…and the toughest part of their schedule is behind them. Their completed home/home series against FSU along with a trip to Durham means that UVA only has two games left against the top of the conference…home against Syracuse and on the road at Pitt.
During the Leitao years, UVA tied for first place in the regular season thanks to one of the easiest schedules in the conference. This “earned” them a higher seeding than their RPI ranking warranted and it came as no surprise when they exited early in the NCAAT. History doesn’t always repeat itself, but sometimes it does. Just something to keep in mind.
One last thing on the arrows…if you look at the arrows of those teams pointing to the middle, I’m not necessarily saying that their remaining schedule is much easier or harder than what they’ve already played. You would have to look at an individual team’s schedule before reaching that conclusion.
For instance, State plays six games against the top 1/3 of the conference and four of those have already been played. So it’s fair to conclude that State’s remaining schedule is a little easier than what has already been played. The purpose of the arrows is to show those teams that will cluster near the top or near the middle once the regular season is over.
One other note, the SOS ranking can change wildly from one day to the next. I prepared a graph yesterday to play around with how I wanted to present the data. Since WF played Syracuse last night, their conference SOS ranking jumped from the middle of the pack to 2nd place based on that one game. But that’s OK because the point of this exercise is not to judge what is happening in the middle of the conference. The point is to identify teams with harder or easier schedules and to see how the unbalanced schedule affects the actual conference standings.
State’s Upcoming Schedule
Well the east-coast road trip we’ve talked about for weeks kicks off Saturday in the Dean Dome. Regardless of how that game turns out, the week off before a trip to Miami the next Saturday should give Gottfried time to pull their heads out of the clouds…or the dumpster.



You must be logged in to post a comment.