It’s time once again to look and see how unbalanced conference schedules affected the ACC season. This is our fourth year with a 16-game conference schedule in a 12-team conference. Our previous looks are listed below, but some of the tables no longer look quite as nice as they did when they were first done.
2006 ACC SOS
2007 ACC SOS
2008 ACC SOS
In previous years, I wrestled the results out of a spreadsheet of my own design. I automated the process as much as I could, but there was still a lot of manual manipulation required….which takes a whole lot of time that I just didn’t have this year. Early on this year, I found that cbssports.com was calculating a “Conference SOS†and displaying on each team’s “RPI Breakdown†page.
I couldn’t find any discussion of this calculation, but my guess is that it uses the basic RPI formula for SOS and only uses conference games. My original goal was to compare my results to cbssports SOS numbers and see if there were any big differences. But life sometimes redirects plans, so we are going to go with the SOS calculations supported with a little common sense review.
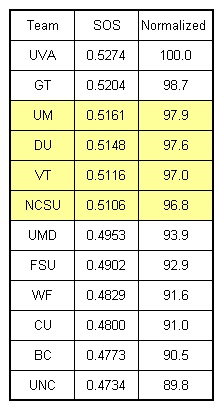
Luckily, I copied the SOS numbers before the ACCT just in case CBS decided to throw the tournament games into the mix….which is exactly what they did. So without further rambling, here are the results for the ACC regular season:

I added a column with normalized results to make it easier to see how much change there is from one position to the next. I highlighted third through sixth place because the differences between those four schedules are so small that they are hard/impossible to see in the breakdowns to follow.
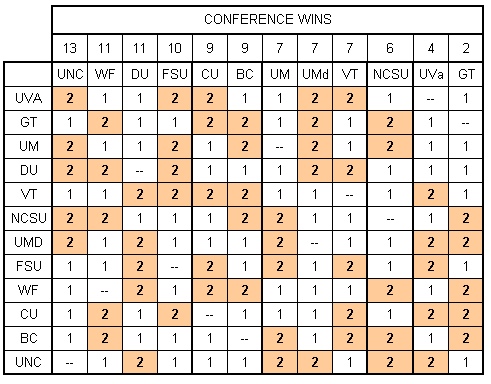
Here is a master schedule for the season sorted by SOS vertically and conference finish horizontally. We’ll start with this breakdown and see what sorts of things jump out.

If you look at the column on the far left and the two columns on the far right, we see how playing UNC twice elevated SOS and playing GT and/or UVA twice dragged it down.
If you look at BC and UNC’s schedules, you will see that both schools came within one game of the easiest possible schedule. Move their second game against Duke (WF) to a second game against GT (UVA) and each school would have the easiest possible schedule.
It would be easy to conclude that the worst teams will always have the hardest schedules and the best teams the easiest….because the teams at the two extremes can’t play themselves. However, this conclusion is more of a tendency, than an absolute fact. The first year that we did this comparison, UNC finished second in the conference and tied for the hardest schedule.
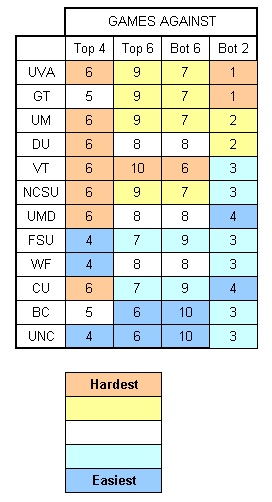
Strictly by the numbers, Duke had the fourth strongest schedule. However, a closer look shows that they played the maximum number of games (6) against the other teams that earned a first-round ACCT bye. The other three teams with a first-round bye all played four games against the top teams in the conference. The only way to increase the difficulty of Duke’s schedule is to move their second game against two 7-win teams to a second game against the two 9-win teams.
I am going to add one more table that parses the games played against different groupings from the standings. I liked the way that this table turned out so I decided to include it. However, this table may prove to be more confusing than enlightening…so study it at your own risk.

I think from an overall perspective, the parsing of the games into groups tends to support the SOS rankings. From one team to the next, the SOS ranking is not always so clear (like Duke vs VT), but overall the parsing does a pretty good job at supporting the SOS rankings.
CONCLUSIONS
The NCAAT Selection Committee made an obvious change several years ago and they don’t select very many teams with losing conference records, regardless of the strength of that conference. This conclusion can be supported from a subjective review of the selections or from a statistical analysis (ie the Dance Card). All of this means that it is interesting to look to see how conference SOS may have affected the NCAAT/NIT selections.
So did SOS affect UM, VT, BC, and Clemson’s post-season tournament?
Well did the officiating affect the VT/UNC game in the ACCT?
I think that it is safe to say that in both cases, the “outside influences†had AN effect…but were not were not the only thing that contributed to the final result. BC had an easy conference schedule, but they also had wins against UNC, Duke, and FSU. Miami had a much tougher schedule, but SOS doesn’t explain losses to NCSU and GT. On balance, I think that the officiating in the VT/UNC game had a lot more to do with the outcome of that game than this year’s conference schedule had to do with any team’s final destination.
FOUR YEAR SUMMARY
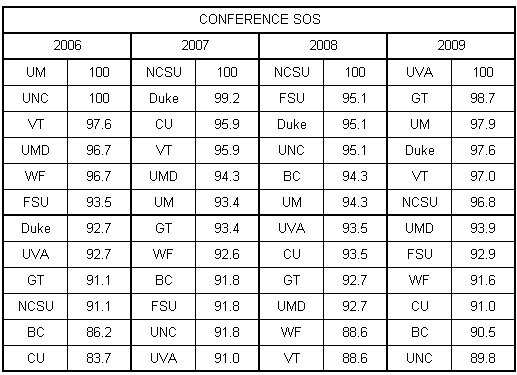
Here is the four year SOS summary with each year normalized against the toughest schedule for that year.

By changing the ranking method this year, you can’t use any sort of averaging or totals of the normalized SOS. However, we can still make some observations:
– Miami has ranked in the top half of the conference in each of the four years. (Though they tied for sixth place in 2007.)
– Duke, NCSU, and VT have ranked in the top half of the conference in three of the four years.
– UVA, Clemson, WF, and BC have ranked in the bottom half of the conference in three of the four years.
Assuming that anyone considered conference SOS when the 16 game rotating schedule was being developed, I suspect that the general consensus was that things would even out over time. However, that conclusion ignores over 50 years of history that says that while teams do move up and down through the standings, there are always teams that are consistently at the top or bottom of the conference for extended periods of time. Thus I expect that the selection of a team’s “primary partners†will have a noticeable effect over time.
An 18-game conference schedule has been discussed before by the conference. As we have said before, this change will probably come to pass….but not until the TV contracts have been properly adjusted. Adding two more games each year should help minimize the difference between the conference’s toughest and easiest schedules.
We’ve had several BB entries recently that should have given everyone an opportunity to vent about the problems in State’s BB program. Keep the griping to those entries and keep the comments here on topic.


You must be logged in to post a comment.